The End of Reflation? Implications for Gold

In the previous editions of the Market Overview, we wrote about the reflation trade. We analyzed the important signals of the uptick in economic activity and inflation all over the world, arguing that the upcoming reflation does not look encouraging for the gold bulls. However, we now see signs that reflation is weakening. What happened and what are the implications for the gold market?
As a reminder, reflation started to attract the attention of investors at the end of 2016 and was based on two pillars: 1) Trump’s rally, i.e. rising expectations about the fiscal stimulus provided by the new administration, and 2) accelerating global inflation and economic growth. As a result, interest rates surged, while the price of gold plunged.
The problem is that both drivers of reflation trade have weakened recently. The failure of Trump to repeal and replace Obamacare undermined markets’ confidence in quick and smooth implementation of the new administration’s pro-growth agenda. Some pundits argue that the Trumpcare’s failure is actually a good thing, because now the administration will quickly shift to the subject of tax reform. However, such a line of argument is totally wrong as it overlooks significant divisions among Republicans and the fact that healthcare reform was supposed to reduce government expenditures, enabling or at least facilitating the tax cuts. This is something we warned against in the February edition of the Market Overview: “the faith in Trump’s beneficial economic policies may be too optimistic.”
Of course, the reflation trade is something bigger than Trump’s rally, as the uptick in economic activity started significantly before the U.S. presidential election. For example, the U.S. annual inflation rate has risen from 0 percent in September 2015 to 2.8 percent in February 2017. However, it slowed down to 2.4 percent in March. We have seen similar dynamics in the Eurozone where the harmonized annual consumer inflation rate slowed down from 2 percent in February to 1.5 percent in March, as one can see in the chart below.
Chart 1: The CPI rate year-over-year for the U.S. (blue line) and the euro area (red line) over the last ten years.
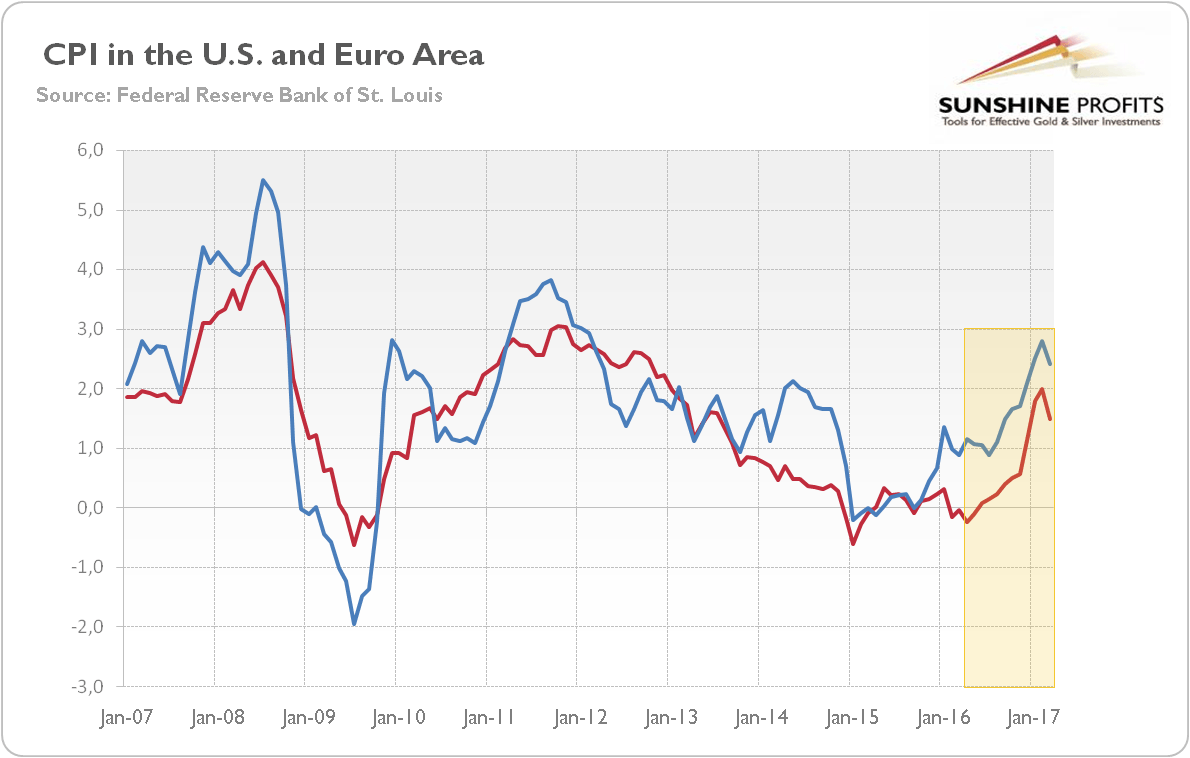
It does not falsify the reflation narrative (the recent pullback may be temporary), but it shows that some investors had inflationary expectations which were too high. As a consequence, U.S. interest rates have declined recently. For example, the 10-year Treasury yield dropped below key 2.3 percent level on April 12, while the yields at 10-year inflation-indexed Treasuries have decreased below 0.40 percent, as the chart below shows.
Chart 2: The price of gold (left axis, yellow line, London P.M. Fix), the U.S. nominal interest rates (green line, right axis, as the 10-year nominal treasury yield, in %) and the real interest rates (red line, right axis, as 10-year inflation-indexed treasury yield, in %) from January 2016 to April 2017.
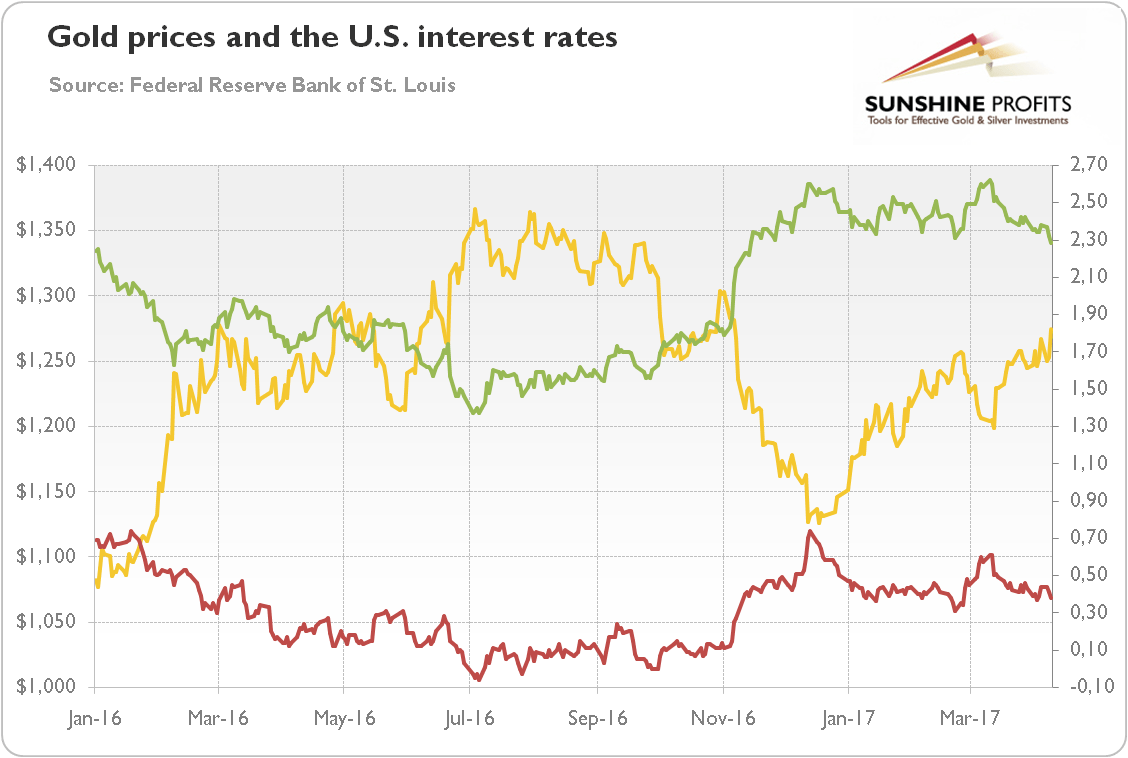
Given the negative correlation between the real interest rates and the gold prices, the recent pullback strengthens the bullish outlook for the price of gold. Moreover, the bond market is more liquid than stock market, so treasuries are often ahead of equities. It implies that we may see some spring corrections on Wall Street, which should be positive for the yellow metal.
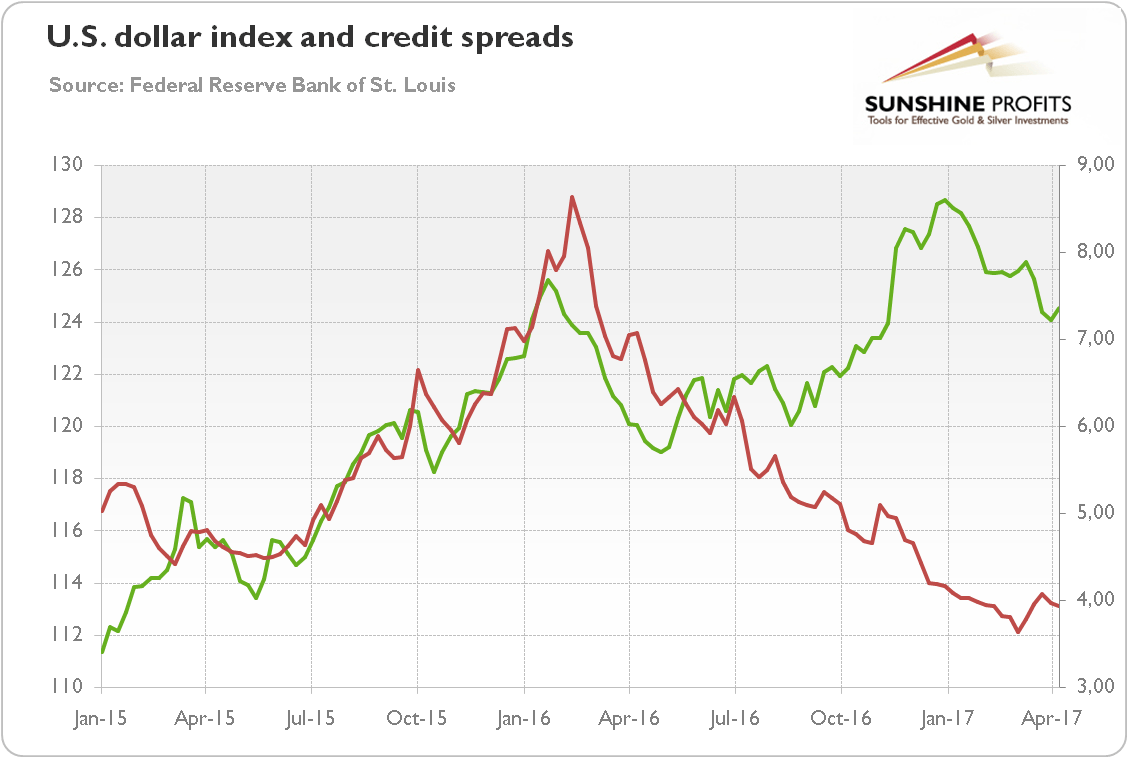
Let’s check other key gold price drivers, which are less bullish. As one can see in the chart below, credit spreads are very low. It indicates high economic confidence, which is bearish for gold. There was a pullback in the U.S. dollar in 2017, but greenback remains in the upward long-term trend – partially because the divergence in monetary policies between the Fed and other major central banks has been widening – which is also negative for the price of gold.
Chart 3: The Trade Weighted Broad U.S. Dollar Index (green line, left scale) and the BofA Merrill Lynch US High Yield Master II Option-Adjusted Spread (red line, right scale, in %) from January 2015 to April 2017.
Therefore, gold drivers send mixed signals. The U.S. dollar and credit spreads remain bearish, while the real interest rates have turned to be bullish recently, as the Trump rally has definitely softened. To be clear: it’s too early to herald the end of reflation, as the improving manufacturing sector in China should be enough to support the reflation trade in the medium term. There will be ups and downs, but the trend should be higher. What we are saying is that the macroeconomic outlook for gold has recently improved on the margin, as the reflation trade lost Trump’s leg.
If you enjoyed the above analysis and would you like to know more about the impact of the current macroeconomic trends and geopolitical uncertainty on the gold market, we invite you to read the May Market Overview report. If you’re interested in the detailed price analysis and price projections with targets, we invite you to sign up for our Gold & Silver Trading Alerts. If you’re not ready to subscribe at this time, we invite you to sign up for our gold newsletter and stay up-to-date with our latest free articles. It's free and you can unsubscribe anytime.
Want free follow-ups to the above article and details not available to 99%+ investors? Sign up to our free newsletter today!
Author

Arkadiusz Sieroń
Sunshine Profits
Arkadiusz Sieroń received his Ph.D. in economics in 2016 (his doctoral thesis was about Cantillon effects), and has been an assistant professor at the Institute of Economic Sciences at the University of Wrocław since 2017.


