|

NZD/USD technical analysis: Buyers resurface at 7-month support level

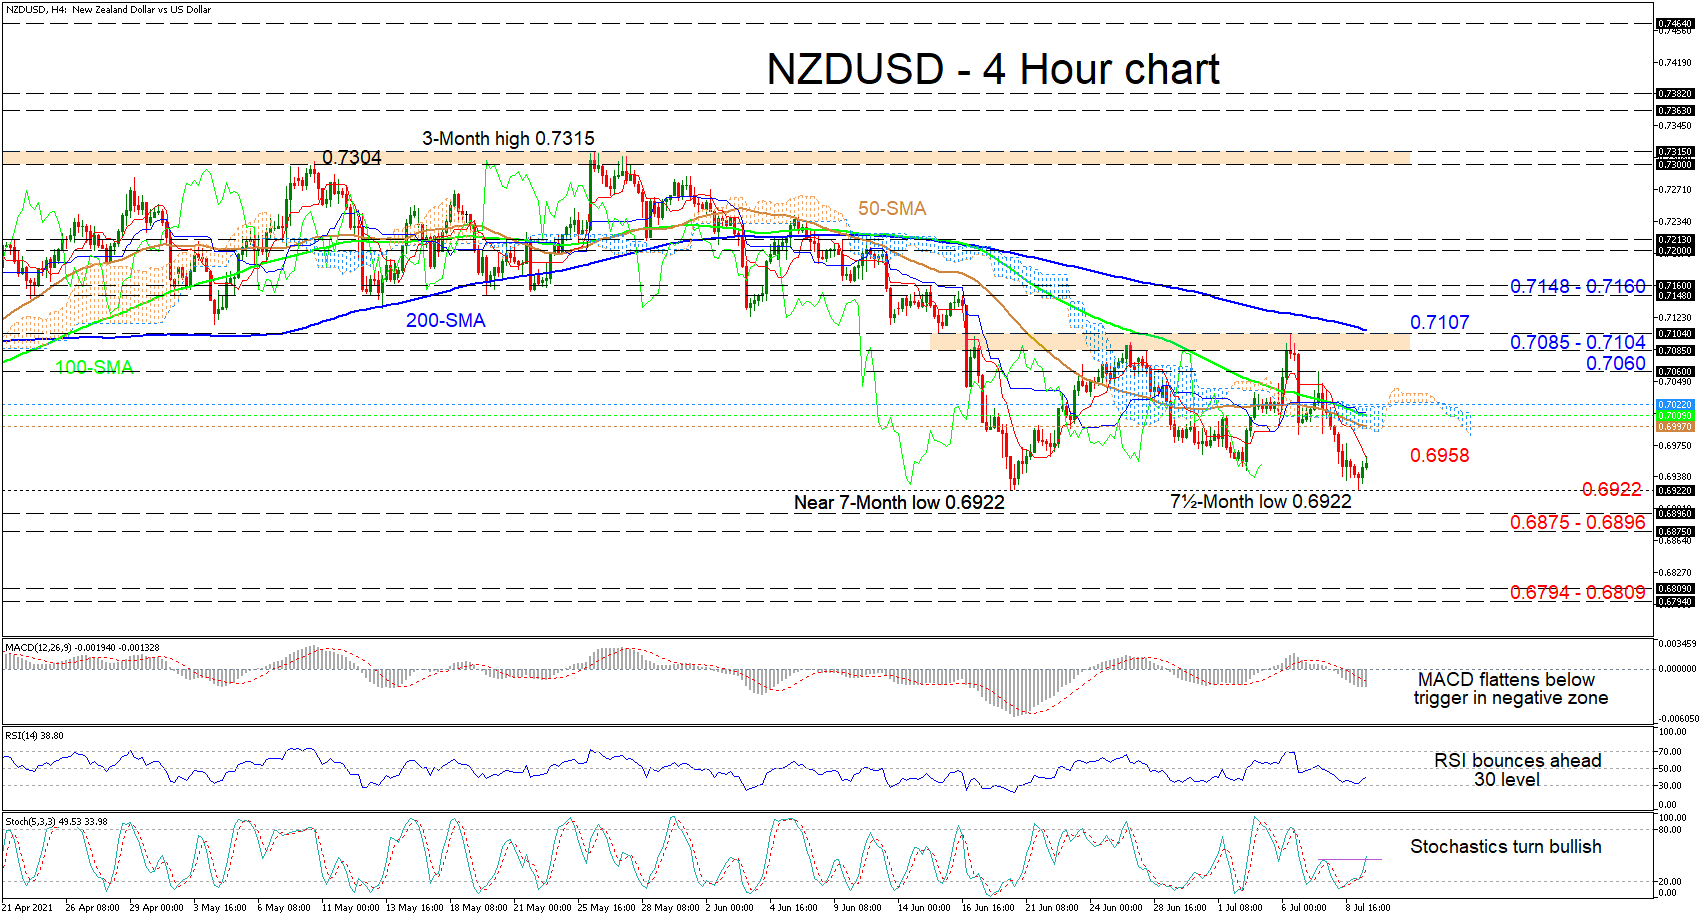
NZDUSD is forming some positive traction off a bounce at the 7-month low of 0.6922, that being the most significant trough since the pair adopted a downwards trajectory from the 3-month high of 0.7315. The bearish simple moving averages (SMAs) are endorsing negative tendencies, while the Ichimoku lines are reflecting that sellers still have a slight upper hand.

The short-term oscillators are indicating a recent uptick in bullish sentiment and are signaling that buyers may try to counter the negative tilt in the pair. The MACD is below zero and is flattening underneath its red trigger line, while the RSI is heading higher in the bearish zone, after a rebound near the 30 levels. The bullish bearing of the stochastic oscillator is also promoting more positive price action.

If price’s push off the low of 0.6922 accelerates past the red Tenkan-sen line at 0.6958, buyers may then face a tough resistance section between the 50-period SMA at 0.6697 and the Ichimoku cloud at 0.7022. Conquering the cloud, the pair may then test the 0.7060 high. Breaching this too could fuel buyers’ belief in recapturing the area above the 0.7085-0.7104 boundary. Note that a jump above the 0.7100 handles and the adjacent 200-period SMA at 0.7107 could boost positive forces.

If selling interest increases again, initial hardened support could emanate from the now tested twice low of 0.6922. Diving below this durable barrier, the bears may encounter a zone of downside constraints shaped between the November 2020 lows of 0.6896 and 0.6875. Sinking further from here could then aim sellers’ radars towards the 0.6794-0.6809 barricade, the latter being the border that had been broken to the upside back in November 2020, which resulted in a four-month steady rally that reached a 43-month peak of 0.7464.

Summarizing, NZDUSD is currently ranging between the 0.6922 floor and the ceiling of 0.7085-0.7104. A break either below the bottom or above the top could set the next near-term direction into motion.

NZDUSD

Author

Anthony Charalambous, CFTe

Anthony Charalambous joined XM in 2019 and specializes in preparing daily technical analysis, using his years of trading experience to provide detailed forecasting for all major asset classes such as forex, indices, commodities and equities.

More from Anthony Charalambous, CFTe
Share:

Markets move fast. We move first.

Orange Juice Newsletter brings you expert driven insights - not headlines. Every day on your inbox.

By subscribing you agree to our Terms and conditions.

Editor's Picks

EUR/USD climbs toward 1.1800 on broad USD weakness

EUR/USD gathers bullish momentum and advances toward 1.1800 in the second half of the day on Tuesday. The US Dollar weakens and helps the pair stretch higher after the employment report showed that Nonfarm Payrolls declined by 105,000 in October before rising by 64,000 in November.

GBP/USD climbs to fresh two-month high above 1.3400

GBP/USD gains traction in the American session and trades at its highest level since mid-October above 1.3430. The British Pound benefits from upbeat PMI data, while the US Dollar struggles to find demand following the mixed employment figures and weaker-than-forecast PMI prints, allowing the pair to march north.

Gold recovers above $4,300 as markets react to weak US data

Gold trades in positive above $4,300 after spending the first half of the day under bearish pressure. XAU/USD capitalizes on renewed USD weakness after the jobs report showed that the Unemployment Rate climbed to 4.6% in November and the PMI data revealed a loss of growth momentum in the private sector in December. 

US Retail Sales virtually unchanged at $732.6 billion in October

Retail Sales in the United States were virtually unchanged at $732.6 billion in October, the US Census Bureau reported on Tuesday. This print followed the 0.1% increase (revised from 0.3%) recorded in September and came in below the market expectation of +0.1%.

Ukraine-Russia in the spotlight once again

Since the start of the week, gold’s price has moved lower, but has yet to erase the gains made last week. In today’s report we intend to focus on the newest round of peace talks between Russia and Ukraine, whilst noting the release of the US Employment data later on day and end our report with an update in regards to the tensions brewing in Venezuela.

BNB Price Forecast: BNB slips below $855 as bearish on-chain signals and momentum indicators turn negative

BNB, formerly known as Binance Coin, continues to trade down around $855 at the time of writing on Tuesday, after a slight decline the previous day. Bearish sentiment further strengthens as BNB’s on-chain and derivatives data show rising retail activity.