Strategy: Why risk premiums have collapsed and why this may change

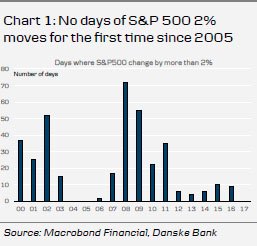
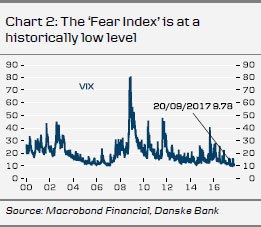
On Wednesday, the FOMC took an historic step and began the long process of unwinding its balance sheet. Financial market volatility rose slightly following the decision but the reaction was short-lived and the VIX volatility index closed on Thursday at lower levels than just before the FOMC decision. Interestingly, at a time when geopolitical risks keep popping up and central banks are moving towards exit, market volatility is at rock bottom. This year is the first year since 2005 that the S&P 500 has not seen a single daily move of more than 2% (see Chart 1), while the VIX volatility index is close to an historical low (Chart 2).
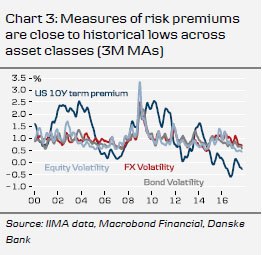
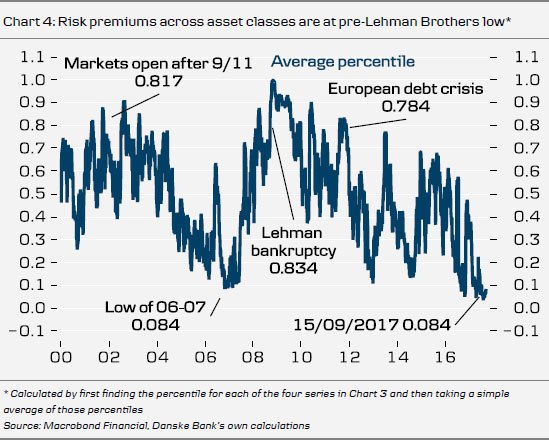
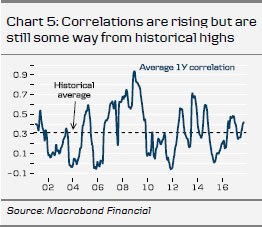
Volatility in bond and FX markets is also at rock bottom, while the 10Y UST term premium, a measure of bond risk premium, is negative (see Chart 3). Currently, average risk premiums across asset classes are at exactly the same level as the pre-Lehman Brothers low (see Chart 4). The multi-decade bottom was reached on 3 August, just before the intensification of the North Korean crisis. The correlation between risk premiums for different asset classes has been rising since 2015 (see Chart 5). However, correlations are still some way from the historical highs of 2008-09. Typically, a high correlation between risk measures will reflect either (1) that risk premiums are low and markets are quietly moving along or (2) that risk premiums are high and markets are in risk-off mode. Combined with charts 3 and 4, the rising correlations show that risk premiums are low across asset classes and markets are quietly moving along. Between asset classes, it appears that risk premiums in bond markets are currently at the most extreme levels, while FX volatility has risen (See Chart 6).
Why are risk premiums so low? One explanation is that nominal GDP growth is currently high relative to short-term interest rates. High growth relative to funding costs supports higher expected returns and higher valuations of equity, credit and other risky assets, which tends to depress risk premiums (see Chart 8). Over the period 2005-07 (and again now), the world was awash with cash, with an abundance of liquidity looking for a home. In our view, this could go some way to explaining the record-low risk premiums.
The million-dollar question is what is the trigger for risk premiums to rise? We doubt that North Korean tensions will be a substantial and permanent driver of higher risk premiums. A military confrontation between the US and North Korea remains a lowprobability but high-impact event for markets ( see Strategy: Don’t get carried away by North Korean market volatility, 11 August). Instead, we see the Fed unwinding its balance sheets and hiking rates as a more likely candidate. Interestingly, the natural rate of interest, i.e. the real interest rate consistent with real GDP equalling its potential level, is falling in the US at the same time as the FOMC is determined to tighten (see Chart 7). As US nominal interest rates rise towards the natural rate, we believe financial volatility and risk premiums across asset classes should rise. This could play out over coming months.
Author

Danske Research Team
Danske Bank A/S
Research is part of Danske Bank Markets and operate as Danske Bank's research department. The department monitors financial markets and economic trends of relevance to Danske Bank Markets and its clients.