|

Riding the bull: Understanding Gold's recent price dynamics

In today's in-depth analysis, I'd like to draw your attention to gold's current market dynamics, which exhibit a robust and convincing buy signal. This recent surge in gold prices can be primarily attributed to the weakening American dollar. However, the movement aligns perfectly with an exemplary technical pattern observed on the chart, reinforcing the strength of this upward momentum.

Recently, we've been following gold closely and highlighting a wedge pattern, outlined with black lines on the chart. This pattern was crucial in identifying key support levels, particularly the 38.2 Fibonacci level, which gold has consistently bounced off.

XAUUSD

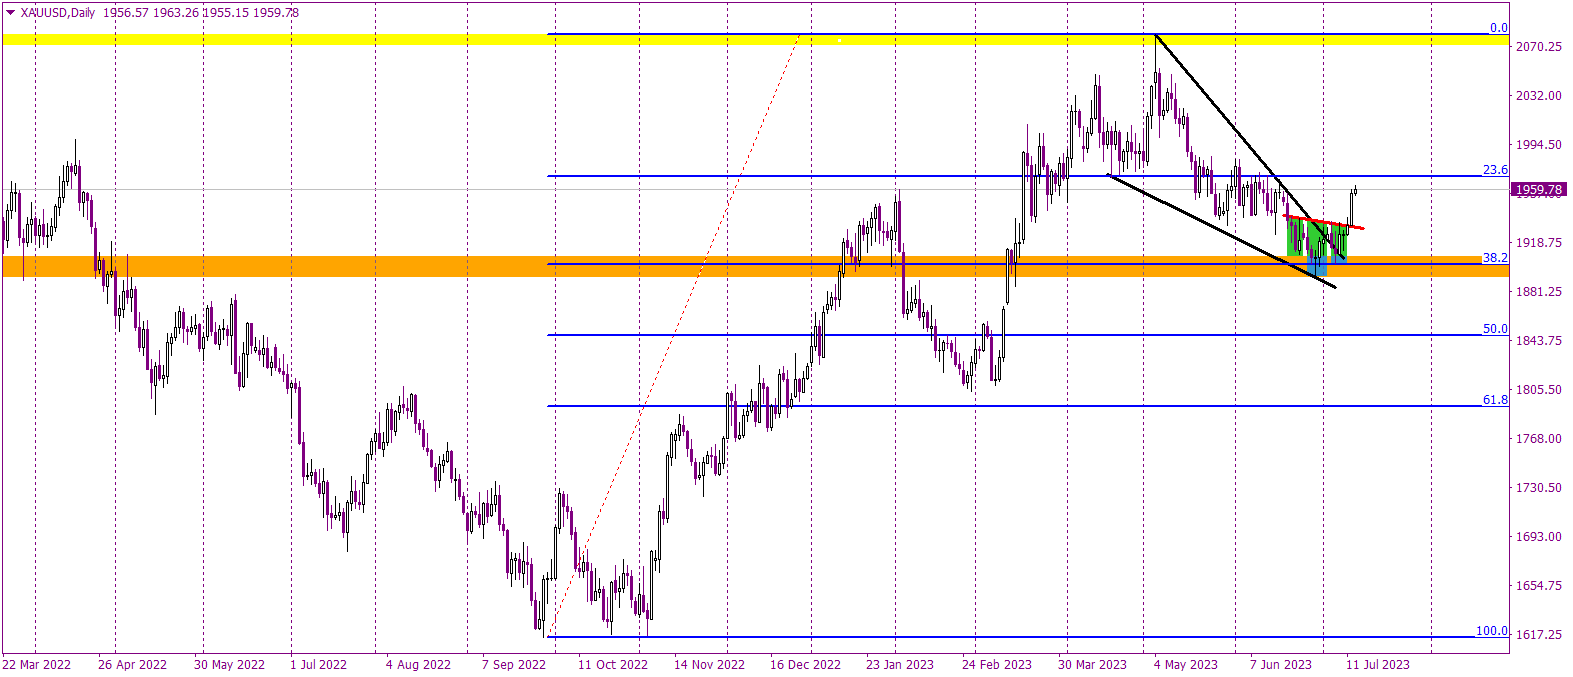
The most recent development in this evolving scenario has been the formation of an inverse head and shoulders pattern. This is a bullish sign in technical analysis and is illustrated with green on the chart. This pattern has seen the price break through the formation's neckline, marked in red. As per technical analysis theory, this breach triggers a buy signal.

So it's no surprise that following this neckline breakout, we've witnessed a substantial rise in the gold price. Therefore, the current sentiment for gold is undeniably positive and will remain so, provided we continue to hover above the 38.2 Fibonacci level.

That said, it's crucial to consider all potential scenarios. A fall in the price below the 38.2 Fibonacci level would issue a sell signal. However, the likelihood of this occurring currently appears minimal. In conclusion, gold's current market position is highly promising, offering excellent opportunities for buyers to capitalize on this positive trend. As always, it's crucial to keep an eye on these technical patterns, as they serve as vital guides in the ever-changing world of market trading.

Author

Tomasz Wisniewski

Tomasz Wisniewski

Axiory Global Ltd.

Tomasz was born in Warsaw, Poland on 25th October, 1985.

More from Tomasz Wisniewski
Share:

Editor's Picks

EUR/USD treads water around 1.1900

EUR/USD edges a tad lower around the 1.1900 area, coming under mild pressure despite the US Dollar keeps the offered stance on turnaround Tuesday. On the US data front, December Retail Sales fell short of expectations, while the ADP four week average printed at 6.5K.

GBP/USD looks weak near 1.3670

GBP/USD trades on the back foot around the 1.3670 region on Tuesday. Cable’s modest retracement also comes in tandem with the decent decline in the Greenback. Moving forward, the US NFP and CPI data in combination with key UK releases should kee the quid under scrutiny in the next few days.

Gold the battle of wills continues with bulls not ready to give up

Gold comes under marked selling pressure on Tuesday, giving back part of its recent two day advance and threatening to challenge the key $5,000 mark per troy ounce. The yellow metal’s correction follows a better tone in the risk complex, a lower Greenback and shrinking US Treasuty yields.

AI Crypto Update: BankrCoin, Pippin surge as sector market cap steadies above $12B

The Artificial Intelligence (AI) segment is largely on the back foot with major coins such as Bittensor (TAO) and Internet Computer (ICP) extending losses amid a sticky risk-off sentiment.

Dollar drops and stocks rally: The week of reckoning for US economic data

Following a sizeable move lower in US technology Stocks last week, we have witnessed a meaningful recovery unfold. The USD Index is in a concerning position; the monthly price continues to hold the south channel support.

XRP holds $1.40 amid ETF inflows and stable derivatives market

Ripple trades under pressure, with immediate support at $1.40 holding at the time of writing on Tuesday. A recovery attempt from last week’s sell-off to $1.12 stalled at $1.54 on Friday, leading to limited price action between the current support and the resistance.