![]() Nick Mastrandrea
Nick Mastrandrea
Market Tea Leaves
Good Morning Traders,
As of this writing 3:50 AM EST, here’s what we see:
US Dollar: Up at 93.300. The US Dollar is up 113 ticks and trading at 93.300.
Energies: June Crude is up at 45.20.
Financials: The June 30 year bond is down 8 ticks and trading at 164.04.
Indices: The June S&P 500 emini ES contract is up 32 ticks and trading at 2055.00.
Gold: The June gold contract is trading up at 1281.40. Gold is 70 ticks higher than its close.
Initial Conclusion
This is not a correlated market. The dollar is up+ and crude is up+ which is not normal but the 30 year bond is trading lower. The Financials should always correlate with the US dollar such that if the dollar is lower then bonds should follow and vice-versa. The indices are up and Crude is trading higher which is not correlated. Gold is trading up which is not correlated with the US dollar trading up. I tend to believe that Gold has an inverse relationship with the US Dollar as when the US Dollar is down, Gold tends to rise in value and vice-versa. Think of it as a seesaw, when one is up the other should be down. I point this out to you to make you aware that when we don’t have a correlated market, it means something is wrong. As traders you need to be aware of this and proceed with your eyes wide open.
Asia traded mainly lower with the exception of the Shanghai and Sensex exchanges which traded higher. As of this writing all of Europe is trading higher.
Possible Challenges To Traders Today
– Challenger Job Cuts y/y is out at 7:30 AM EST. This is major.
– Unemployment Claims are out at 8:30 AM EST. This is major.
– Prelim Unit Labor Costs q/q is out at 8:30 AM EST. This is major.
– Natural Gas Storage is out at 10:30 AM EST. This is major.
– FOMC Member Bullard Speaks at 11:30 AM. This is major.
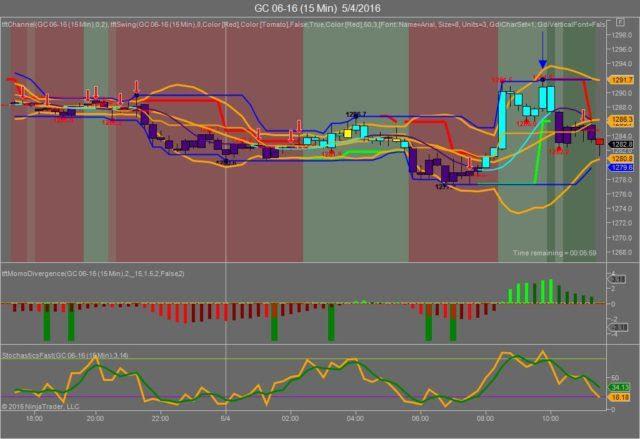
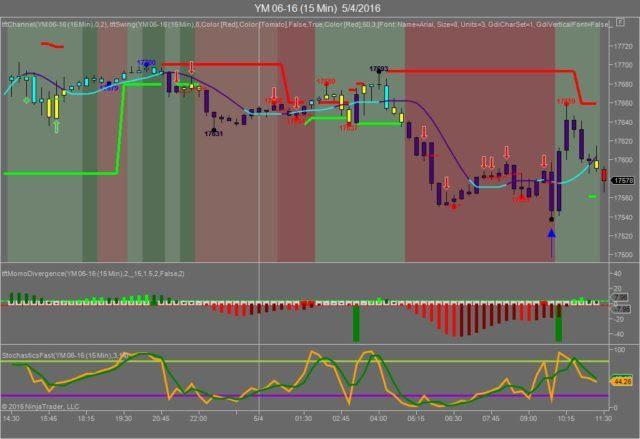
Gold
We’ve elected to switch gears a bit and show correlation between Gold and The YM futures contract. The YM contract is the DJIA and the purpose is to show reverse correlation between the two instruments. Remember it’s liken to a seesaw, when up goes up the other should go down and vice versa.
Yesterday Gold made it’s move at around 9:45 AM EST after the 8:30 round of economic news was reported. The YM hit a low at around that time and Gold hit a high. If you look at the charts below the YM gave a signal at around 9:45 AM EST, while Gold also gave a signal at just about the same time. Look at the charts below and you’ll see a pattern for both assets. The YM hit a low at around 9:45 AM EST and Gold hit a high. These charts represent the latest version of Trend Following Trades and I’ve changed the timeframe to a 15 minute chart to display better. This represented a shorting opportunity on Gold, as a trader you could have netted about 50 plus ticks per contract on this trade. Each tick is worth $10. We added a Donchian Channel to the charts to show the signals more clearly.
Charts Courtesy of Trend Following Trades built on a NinjaTrader platform
Bias
Yesterday we gave the markets a neutral bias as the futures had no sense of direction yesterday morning. The Dow dropped 100 points and the other indices lost ground as well. Today we aren’t dealing with a correlated market however our bias is to the upside.
Could this change? Of Course. Remember anything can happen in a volatile market.
Commentary
Yesterday we gave the markets a neutral bias which means it could go in any direction. The ADP Employment report came out at 8:15 AM EST and showed a decline in numbers of jobs created. This in turn drove the markets lower and even after the opening bell the markets went south and didn’t look back. The “good” news here is that the Fed will be very reluctant to raise rates or even think about raising rates in the near term. Today we have Challenger Jobs cuts out at 7:30 AM EST and this will set market direction for the day as well. BTW today is Cinco de Mayo and regardless of where you live you must admit that we could all use a more festive market…
Trading performance displayed herein is hypothetical. The following Commodity Futures Trading Commission (CFTC) disclaimer should be noted.
Hypothetical performance results have many inherent limitations, some of which are described below. No representation is being made that any account will or is likely to achieve profits or losses similar to those shown.
In fact, there are frequently sharp differences between hypothetical performance results and the actual results subsequently achieved by any particular trading program. One of the limitations of hypothetical performance trading results is that they are generally prepared with the benefit of hindsight.
In addition, hypothetical trading does not involve financial risk, and no hypothetical trading record can completely account for the impact of financial risk in actual trading. For example, the ability to withstand losses or to adhere to a particular trading program in spite of trading losses are material points which can also adversely affect actual trading results.
There are numerous other factors related to the markets in general or to the implementation of any specific trading program which cannot be fully accounted for in the preparation of hypothetical performance results and all of which can adversely affect actual trading results.
Trading in the commodities markets involves substantial risk and YOU CAN LOSE A LOT OF MONEY, and thus is not appropriate for everyone. You should carefully consider your financial condition before trading in these markets, and only risk capital should be used.
In addition, these markets are often liquid, making it difficult to execute orders at desired prices. Also, during periods of extreme volatility, trading in these markets may be halted due to so-called “circuit breakers” put in place by the CME to alleviate such volatility. In the event of a trading halt, it may be difficult or impossible to exit a losing position.
Recommended Content
Editors’ Picks
EUR/USD eases to near 1.0700 ahead of German inflation data

EUR/USD is paring gains to near 1.0700 in the European session on Monday. The pair stays supported by a softer US Dollar, courtesy of the USD/JPY sell-off and a risk-friendly market environment. Germany's inflation data is next in focus.
USD/JPY recovers after testing 154.50 on likely Japanese intervention

USD/JPY is recovering ground after sliding to 154.50 on what seemed like a Japanese FX intervention. The Yen tumbled in early trades amid news that Japan's PM lost 3 key seats in the by-election. Focus shifts to the US employment data and the Fed decision later this week.
Gold price holds steady above $2,335, bulls seem reluctant amid reduced Fed rate cut bets

Gold price (XAU/USD) attracts some buyers near the $2,320 area and turns positive for the third successive day on Monday, albeit the intraday uptick lacks bullish conviction.
Ripple CTO shares take on ETHgate controversy, XRP holders await SEC opposition brief filing

Ripple loses all gains from the past seven days, trading at $0.50 early on Monday. XRP holders have their eyes peeled for the Securities and Exchange Commission filing of opposition brief to Ripple’s motion to strike expert testimony.
Week ahead: FOMC and jobs data in sight

May kicks off with the Federal Open Market Committee meeting and will be one to watch, scheduled to make the airwaves on Wednesday. It’s pretty much a sealed deal for a no-change decision at this week’s meeting.