Good Morning Traders,
As of this writing 5:30 AM EST, here’s what we see:
US Dollar: Up at 81.580, the US Dollar is up 57 ticks and is trading at 81.580.
Energies: September Crude is down at 97.58.
Financials: The Sept 30 year bond is down 13 ticks and trading at 137.00.
Indices: The Sept S&P 500 emini ES contract is down 36 ticks and trading at 1915.75.
Gold: The August gold contract is trading up at 1284.30 and is down 30 ticks from its close.
Initial Conclusion
This is not correlated market. The dollar is up+ and oil is down- which is normal but the 30 year bond is trading lower. The Financials should always correlate with the US dollar such that if the dollar is lower then bonds should follow and vice-versa. The indices are down and the US dollar is trading up which is correlated. Gold is trading higher which is not correlated with the US dollar trading up. I tend to believe that Gold has an inverse relationship with the US Dollar as when the US Dollar is down, Gold tends to rise in value and vice-versa. Think of it as a seesaw, when one is up the other should be down. I point this out to you to make you aware that when we don’t have a correlated market, it means something is wrong. As traders you need to be aware of this and proceed with your eyes wide open.
All of Asia traded lower following Wall Street’s triple digit loss. As of this writing all of Europe is trading lower.
Possible Challenges To Traders Today
Non-Farm Employment Change is out at 8:30 AM EST. This is major.
Unemployment Rate is out at 8:30 AM EST. This is major.
Average Hourly Earnings m/m is out at 8:30 AM EST. This is not major.
Core PCE Price Index m/m is out at 8:30 AM EST. This is major.
Personal Spending m/m is out at 8:30 AM EST. This is not major.
Personal Income m/m is out at 8:30 AM EST. This is not major.
Final Manufacturing PMI is out at 9:45 AM EST. This is major.
Revised UoM Consumer Sentiment is out at 9:55 AM EST. This is not major.
Revised UoM Inflation Expectations is out at 9:55 AM EST. This is not major.
ISM Manufacturing PMI is out at 10 AM EST. This is major.
Construction Spending m/m is out at 10 AM EST. This is major.
ISM Manufacturing Prices is out at 10 AM EST. This is not major.
Total Vehicle Sales – All Day, major.
Currencies
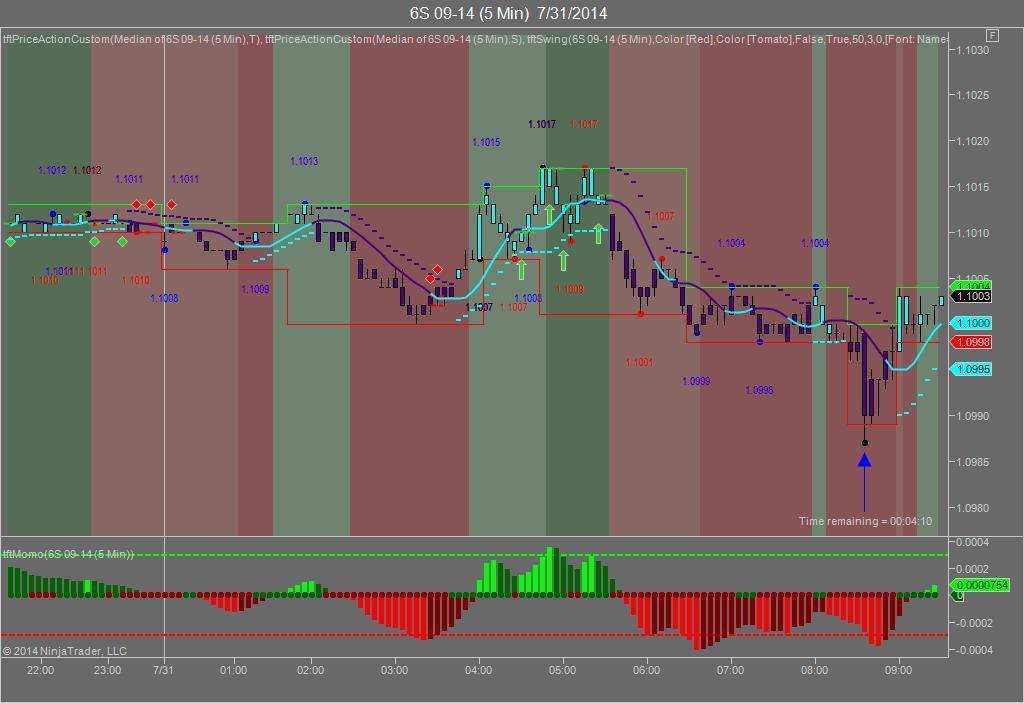
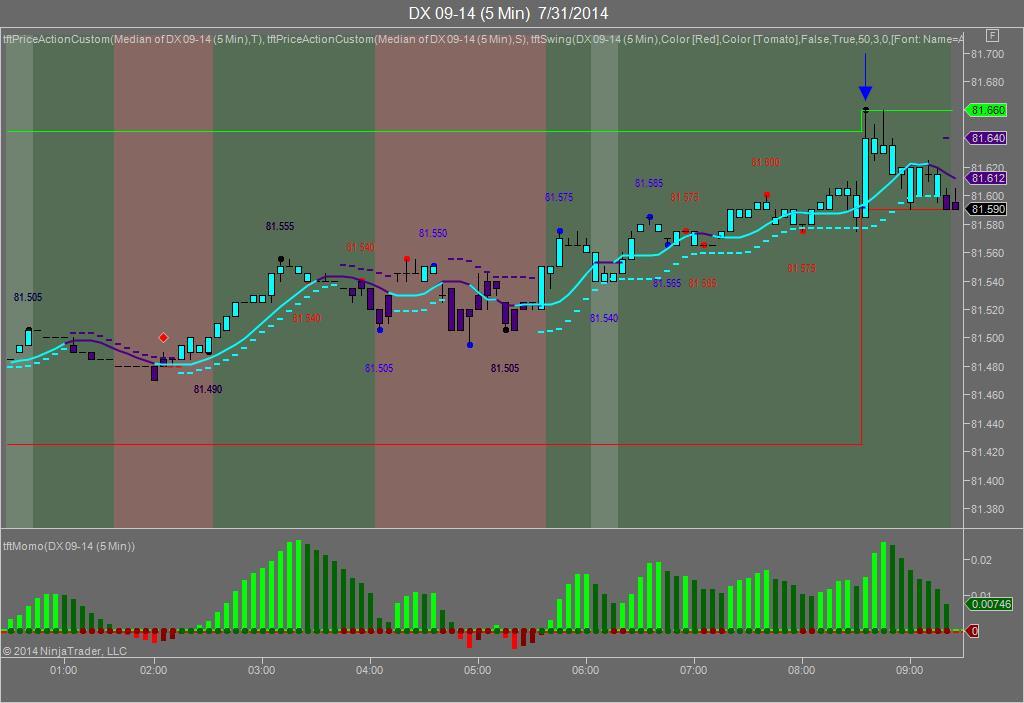
Yesterday the Swiss Franc made it’s move at 8:35 AM EST immediately after the Unemployment Claims numbers were released. The USD hit a high at around that time and the Swiss Franc hit a low. If you look at the charts below the USD gave a signal at 8:35 AM EST, while the Swiss Franc also gave a signal at just about the same time. Look at the charts below and you’ll see a pattern for both assets. The USD hit a high at 8:35 AM EST and the Swiss Franc hit a low. I’ve changed the charts to reflect a 5 minute time frame and added a Darvas Box to make it more clear. This represented a long opportunity on the Swiss Franc, as a trader you could have easily netted 20 plus ticks on this trade. Remember each tick on the Swiss Franc is equal to $12.50 versus $10.00 that we usually see for currencies.
Charts Courtesy of Trend Following Trades built on a NinjaTrader platform
Bias
Yesterday we said our bias was to the downside as the markets were nearly correlated in that direction. The Dow dropped 317 points and the other indices lost ground as well. Today is Jobs Friday and as such our bias is neutral.
Could this change? Of Course. Remember anything can happen in a volatile market.
Commentary
Yesterday morning the markets were nearly correlated to the downside hence our bias was down. Challenger Job Cuts showed an increase in the number of firms that may be laying people off. Additionally at 8:30 AM the Unemployment Claims numbers were released that showed an increase. This does not bode well for an economy that’s supposed to be adding jobs. Lastly Chicago PMI came out at 9:45 AM that showed a decrease in business activity. Some analysts will of course say that this is due to “seasonal factors” and there may be some measure of truth but the markets ran with that and dropped over 300 points. I don’t believe we’ve seen that for years. The last time was in 2011 during the budget crisis. Today we have 13 economic reports and if anyone wanted to throw gasoline on the fire, this is the way to do it. 13 economic reports in one day? Are these people nuts or what? We maintain a neutral bias because it’s Jobs Friday and the markets have never shown any sense of normalcy but quite frankly this is a good day to forget about the markets and go out somewhere as there’s far too much volatility…
We knew yesterday that the markets would drop, not because of the economic reports but because our rules of market correlation told us so.
Trading performance displayed herein is hypothetical. The following Commodity Futures Trading Commission (CFTC) disclaimer should be noted.
Hypothetical performance results have many inherent limitations, some of which are described below. No representation is being made that any account will or is likely to achieve profits or losses similar to those shown.
In fact, there are frequently sharp differences between hypothetical performance results and the actual results subsequently achieved by any particular trading program. One of the limitations of hypothetical performance trading results is that they are generally prepared with the benefit of hindsight.
In addition, hypothetical trading does not involve financial risk, and no hypothetical trading record can completely account for the impact of financial risk in actual trading. For example, the ability to withstand losses or to adhere to a particular trading program in spite of trading losses are material points which can also adversely affect actual trading results.
There are numerous other factors related to the markets in general or to the implementation of any specific trading program which cannot be fully accounted for in the preparation of hypothetical performance results and all of which can adversely affect actual trading results.
Trading in the commodities markets involves substantial risk and YOU CAN LOSE A LOT OF MONEY, and thus is not appropriate for everyone. You should carefully consider your financial condition before trading in these markets, and only risk capital should be used.
In addition, these markets are often liquid, making it difficult to execute orders at desired prices. Also, during periods of extreme volatility, trading in these markets may be halted due to so-called “circuit breakers” put in place by the CME to alleviate such volatility. In the event of a trading halt, it may be difficult or impossible to exit a losing position.
Recommended Content
Editors’ Picks
AUD/USD gains ground on hawkish RBA, Nonfarm Payrolls awaited

The Australian Dollar continues its winning streak for the third successive session on Friday. The hawkish sentiment surrounding the Reserve Bank of Australia bolsters the strength of the Aussie Dollar, consequently, underpinning the AUD/USD pair.
USD/JPY: Japanese Yen advances to nearly three-week high against USD ahead of US NFP

The Japanese Yen continues to draw support from speculated government intervention. The post-FOMC USD selling turns out to be another factor weighing on the USD/JPY pair. Investors now look forward to the crucial US NFP report for a fresh directional impetus.
Gold recoils on hawkish Fed moves, unfazed by dropping yields and softer US Dollar

Gold price clings to the $2,300 figure in the mid-North American session on Thursday amid an upbeat market sentiment, falling US Treasury yields, and a softer US Dollar. Traders are still digesting Wednesday’s Federal Reserve decision to hold rates unchanged.
Solana price pumps 7% as SOL-based POPCAT hits new ATH

Solana price is the biggest gainer among the crypto top 10, with nearly 10% in gains. The surge is ascribed to the growing popularity of projects launched atop the SOL blockchain, which have overtime posted remarkable success.
NFP: The ultimate litmus test for doves vs. hawks

US Nonfarm Payrolls will undoubtedly be the focal point of upcoming data releases. The estimated figure stands at 241k, notably lower than the robust 303k reported in the previous release and below all other readings recorded this year.

