![]() Andre Gratian
Andre Gratian
Market Turning Points
"By the Law of Periodical Repetition, everything which has happened once must happen again, and again, and again -- and not capriciously, but at regular periods, and each thing in its own period, not another's, and each obeying its own law... The same Nature which delights in periodical repetition in the sky is the Nature which orders the affairs of the earth. Let us not underrate the value of that hint." ~ Mark Twain
Current Position of the Market
SPX Long-term trend: The beginning of a lengthy correction ismost likely underway!
SPX Intermediate trend: May be in the process of forming a H&S bull market top.
Analysis of the short-term trend is done on a daily basis with the help of hourly charts. It is animportant adjunct to the analysis of daily and weekly charts which discuss longer market trends.
Market Overview
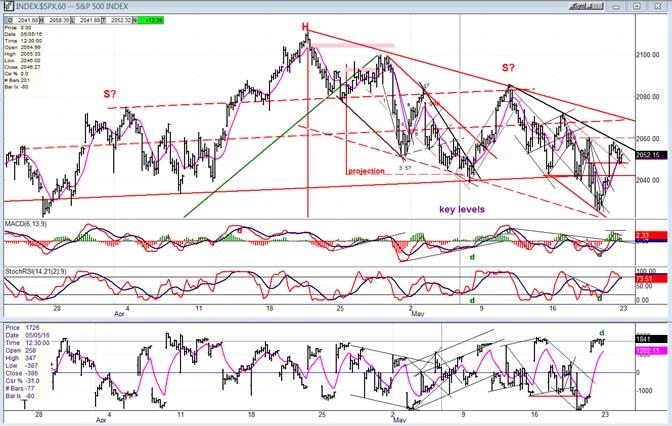
On 4/20, the SPX rally that started at 1810 came to an end at 2111. From that point, the index declined until it reached 2040 -- which was mentioned repeatedly as an important support level -- found good buying at that level, and rallied to 2085 before reversing again. The next decline continued until last Thursday, but this time did not find support until 2026. However, by closing the week at 2052, the index again closed well above support. The coming week should give us some important clues about what the market wants to do next. If the current rally is going to match the previous one in time and price, it could end as early as Monday at 2069!
In fact, this could very well be what happens. As we will see on the daily chart, 2069 is where the rally would meet with resistance at the downtrend line from 2111. Furthermore, it also corresponds to a projection taken across the base which was formed at Thursday’s low. If that does take place, and SPX starts down again, we could go through the 2040 support level decisively this time, and that is what would be required to confirm the formation that was discussed in the last two letters as a possible H&S pattern. It would also provide some clarity about what the index would do next since, a decline below the neckline is usually followed by a return move before the downtrend resumes.
On the other hand, if this rally extends beyond SPX 2085, it would probably change the path on which the current short-term trend appears to be proceeding, and a re-evaluation of the market’s intention would have to be made.
SPX Chart Analysis
Daily chart (This chart, and others below, are courtesy of QCharts.com.)
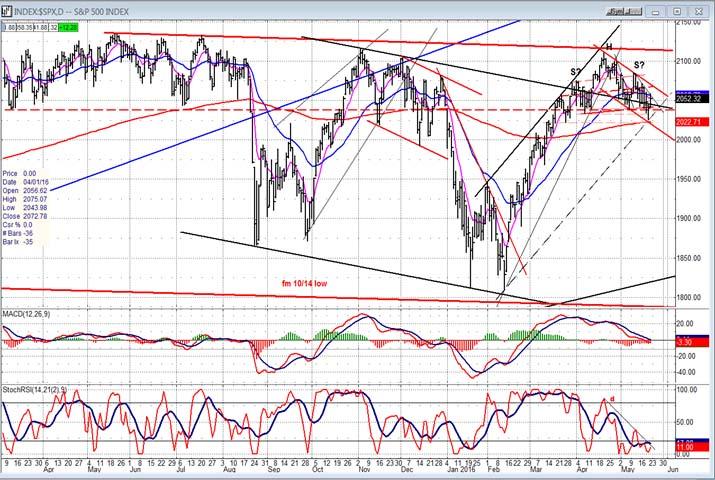
This chart of the SPX which goes back to the 2135 top shows that, since then, the index has had some wild swings between 1810 and a trend line drawn across the highs,with most of the trading taking place above 2040. This is why that level is so important as support. Since we managed to rise above it again after finding support near the low of a wide channel (heavy red lines), SPX is keeping us guessing about whether or not it wants to extend its uptrend to a new high, or if it is ready to decline to the low of the channel once again.
The blue trend line which was broken in August of last year is the bottom trend line of an intermediate channel which started in October 2011. It was back-tested during the first rally, held, and sent us for another spin toward the bottom of the larger channel. On that decline, we found support just above the long-term trend line which goes back to the beginning of the bull market, in March 2009. A segment of it is visible in the bottom right corner of the chart. We can probably assume that a new bear market will not be confirmed until we trade below that trend line. Until we do, the remote possibility exists that we could make a new high before a conclusive end to the bull market.
Why remote? Because the degree of distribution which has taken place between December 2014 and August 2015 carries a P&F count which is far greater than what has already been achieved by the second decline. This is why it is incumbent upon the bulls to prove this count wrong by taking the index to a new high over the relatively near-term. Time is not on their side, nor is the pattern which is currently being created. It is looking more and more like a nearly complete H&S pattern which, if this is what it turns out to be, will give us a P&F count slightly above the one exacted from the top formation. This is why what the SPX does over the next few days is so important.
Hourly chart
I have also compacted the hourly chart so that we can see the full extent of the potential H&S pattern which is forming. The current rally should tell us if we are going to complete it, or if it will turn into a more bullish pattern.
Thursday’s low came near the bottom of the red channel, with the SPX showing no sign of the price deceleration which typically precedes a breakout to the upside. This is why we stand a chance of completing the rally on Monday around 2070. In addition to the two conditions mentioned above which favor this outcome, we can add a third:the dashed parallel to the neckline drawn from the 2056 short-term top on the far left of the chart. After breaking the steepest trend line, the rally was stopped for a fullday by the heavy black trend line which it must now break to challenge the more important red trend line.
Because the index paused for such a long time at the black trend line, the oscillators actually turned down.This means that the odds favor that they will show divergence at the next high. A small break of the red trend line is possible, but what would change the picture dramatically would be if the index were to pick up strength afterwards and continue past 2085.
SPX et al…
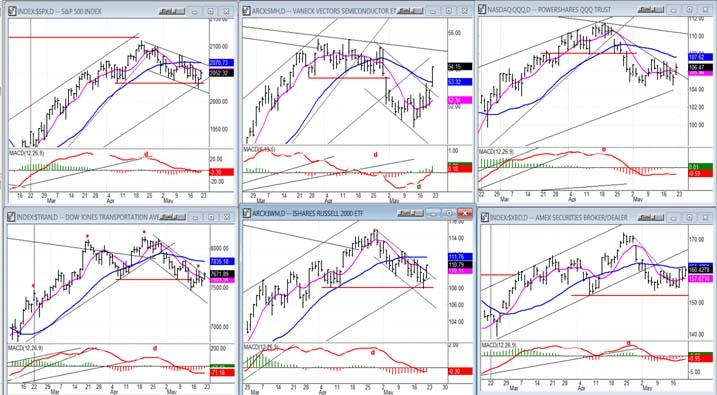
Last week was a mixed bag for the leading indexes. The TRAN showed the most relative weakness to the SPX, with IWM a close second. QQQ and XBD held their recent lows, and SMH showed some good strength. What happens over the next week will undoubtedly be more meaningful. Let’s see where we are next Friday.
UUP (Dollar ETF)
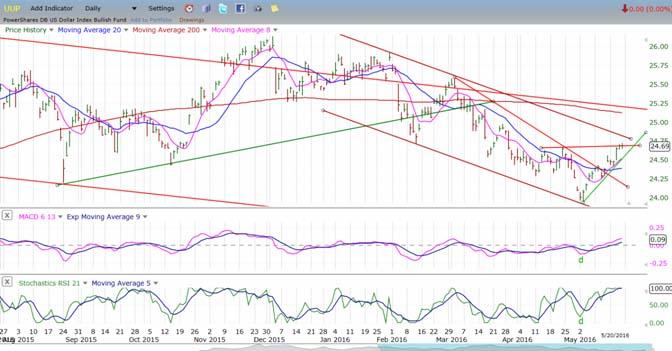
UUP is trying to convince us that it has made animportant low, that it has concluded its intermediate correction, and is now ready to resume its long-term uptrend. It will be more credible if it can continue its short-term uptrend and move completely out of its corrective short-term channel,and goeson to challenge the larger one whose top line coincides with the 200-DMA. The alternative would be that it is making a pattern similar to what it did in February-March, and pulls back after reaching 24.75.
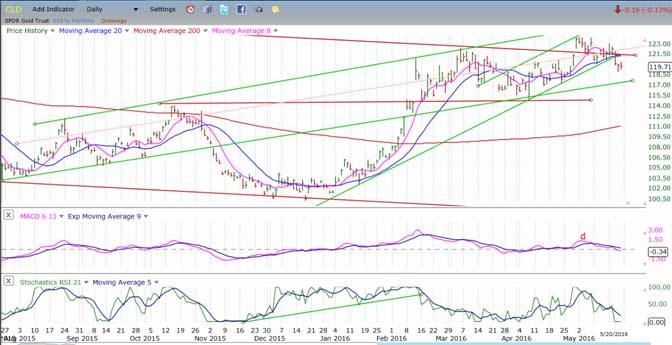
GLD (GoldETF)
With so many recenttests of its uptrend line which only resulted in bounces, it was only a matter of time before that trend line was broken. This happened last week, but it may only result in limited weakness since there is another trend line which can act as support a point or two lower. The P&F chart seems to concur with only a small distribution pattern at the 122 level which projects a move down to 117. That does not preclude additional distribution after this move is over to establish lower counts. Commitment of Traders also favor a larger retracement.
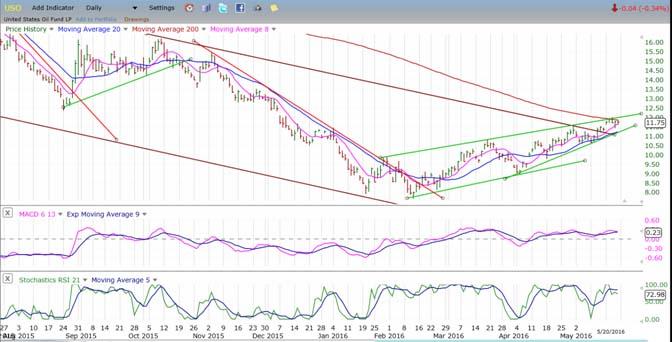
USO (US Oil Trust)
USO met its 12 projection right on the nose and pulled back immediately. Nevertheless, there has not been any real technical damage done, and the index would have to break below 11.50 in order to challenge its upper trend line. It may have to return to 12 first in order to create the necessary distribution pattern in the P&F chart for such a move to occur.
Summary
There is (very) important support for the SPX between 2040 and 2043. It will have to be broken decisively in order for the index to resume its long-term downtrend. The last two challenges to it have been met successfully at 2040 and 2026. Will the third time, if (when) it occurs be the charm? Most likely!
The comments made in the daily updates and the Market Summary about the financial markets are based purely on what I consider to be sound technical analysis principles. They represent my own opinion and are not meant to be construed as trading or investment advice, but are offered as an analytical point of view which might be of interest to those who follow stock market cycles and technical analysis.
Recommended Content
Editors’ Picks
AUD/USD extends its upside above 0.6600, eyes on RBA rate decision

The AUD/USD pair extends its upside around 0.6610 during the Asian session on Monday. The downbeat US employment data for April has exerted some selling pressure on the US Dollar across the board. Investors will closely monitor the Reserve Bank of Australia interest rate decision on Tuesday.
EUR/USD: Optimism prevailed, hurting US Dollar demand

The EUR/USD pair advanced for a third consecutive week, accumulating a measly 160 pips in that period. The pair trades around 1.0760 ahead of the close after tumultuous headlines failed to trigger a clear directional path.
Gold bears take action on mixed signals from US economy

Gold price fell more than 2% for the second consecutive week, erased a small portion of its losses but finally came under renewed bearish pressure. The near-term technical outlook points to a loss of bullish momentum as the market focus shifts to Fedspeak.
Bitcoin Cash could become a Cardano partnerchain as 66% of 11.3K voters say “Aye”

Bitcoin Cash is the current mania in the Cardano ecosystem following a proposal by the network’s executive inviting the public to vote on X, about a possible integration.
Week ahead: BoE and RBA decisions headline a calm week

Bank of England meets on Thursday, unlikely to signal rate cuts. Reserve Bank of Australia could maintain a higher-for-longer stance. Elsewhere, Bank of Japan releases summary of opinions.