Oil 2019 Forecast: Dwindling demand and substantial supply likely to pressure petrol

2018 was an exciting year for oil prices. The climbed up the stairs throughout most of the year only to come down through the elevator shaft later on.
2019 may be somewhat less exciting and could endure lower prices. Demand is likely to dwindle down amid a global slowdown. Supply is set to remain abundant due to the main actors' reluctance to cut production. And the range may be limited by the quick shifts in production that US shale producers have mastered.
2018 - up, up, and down
Throughout most of the year, prices increased. The pickup in global and US growth in the second quarter is one decisive factor. Another was a successful cut in production by OPEC, led by Saudi Arabia, and non-OPEC countries, led by Russia.
Yet the tipping point for demand to beat supply was the cancelation of the Iran deal, known as JCPOA. The US intent to impose sanctions and even cut Iranian exports to zero sent petrol prices higher.
Things changed in the second half of the year. Global growth slowed down due to the ongoing rate hikes by the Fed, Trump's trade war, hiccups in the German car industry, Brexit concerns, among other reasons.
Another factor was the slippage of the OPEC / Non-OPEC deals, with lower discipline among members. Russia reached record post-Soviet production with 11.3 million barrels per day.
All in all, supply growth outpaced expectations by around 2.5 mppd, against an outpace of 2 mpbd forecast in July.
And once again, Trump and Iran were the tipping points. The President issued a waiver on buying oil from Iran for eight countries, watering down the sanctions.
Oil prices plunged and were not helped by a messy OPEC decision in November.
What's next?
2019 - A year of suffering?
Demand is expected to fall. The International Energy Agency (IEA), cut its demand forecast for OPEC oil by 300,000 bpd in 2019. Given current economic trends, this is unsurprising. Global growth is projected to slow from 3.7% to 3.5%.
OPEC also states that global growth trends have become more fragile. Oil demand is projected to rise by 1.29 mbpd according to OPEC, down some 160,000 lower than previously estimated.
The more significant shifts may be in supply. According to OPEC once again, non-OPEC supply is projected to grow by 2.16 mpbd next year, a small upward revision. IEA forecasts for supply have not changed much.
The three big players in oil production are Russia, Saudi Arabia, and the US. They all produce at similar levels and are responsible for around 40% of global output.
US shale is the big swing player. The production in the Permian Basin, North Dakota, and other places suffered from some bottlenecks due to increased supply. Once these bottlenecks are resolved, US production is set to surpass 12 mpbd.
After the historic crash in oil prices in late 2014, the US industry adapted. While some companies went bust, productivity improved to meet lower prices and output emerged from the lows and reached new records. According to the Energy Information Association (EIA), the US became a net exporter of crude and other oil products for the first time since at least 1991.
All in all, the picture for 2019, according to what we know now, is not too shiny for the black gold.
Lower volatility?
And it may not be that great for traders too. As US dominance in oil output grows, so will the impact of the flexibility in its production. Shale production using fracking is much more flexible than the large-scale installations used in Saudi Arabia, Russia, and other countries.
When prices rise, more rigs come online to meet demand, consequently depressing prices. When prices fall, the non-profitable platforms are shut down quickly, lowering supply and hence pushing prices back up. This flexibility in production is set to limit volatility.
Volatility could be impacted by the value of the US Dollar. In the past, the greenback and the black gold had an inverse correlation. In 2018, this correlation was patchy at best. A return of the relationship could have an impact on the volatility, perhaps extending it by a bit. A deteriorating global environment can push the safe-haven USD higher alongside a drop in oil prices.
Upside surprises to consider
While lower prices and lower volatility remain our base case scenario, there is always room for surprises in oil markets. A significant chunk of the black gold still comes from unstable countries.
Here are some factors to consider:
- Venezuelan production is falling together with the country's economic crash. Things could get worse if the country's political situation further deteriorates. Chaos in the South American Country could halt output altogether and push prices higher.
- Iran and Saudi Arabia; The two regional powers are fighting proxy wars in Syria and Yemen but have never clashed directly. For oil prices to rise, it would only take a blockade of the Straights of Hormuz, leading to the Persian Gulf, to send prices shooting higher.
- Libya, Nigeria, and Iraq have seen disruptions in output, that have been part of the ebb and flow of oil day traders but did not affect the bigger picture in the longer term. A more permanent disruption could change things.
- Canadian oil: The Western Canada Select (WCS) price has been trading far lower than the benchmark American West Texas Intermediate due to bottlenecks in shipping Canadian oil from Alberta's tar sands to ports in the Gulf of Mexico. The regional government in Edmonton surprised with a decision to cut output. The move has only had an impact on WCS. A more significant output cut could reverberate around the world.
- And there is always US President Donald Trump. He currently urges OPEC to keep the taps open as he wants lower oil prices for the American consumer. He may change his mind and decide that helping the local energy industry is more important. Or he may close the net on Iran. If the waiver on buying Iranian oil is removed, prices could move higher once again.
WTI Crude Technical Analysis
We use the weekly chart in order to see the big picture.
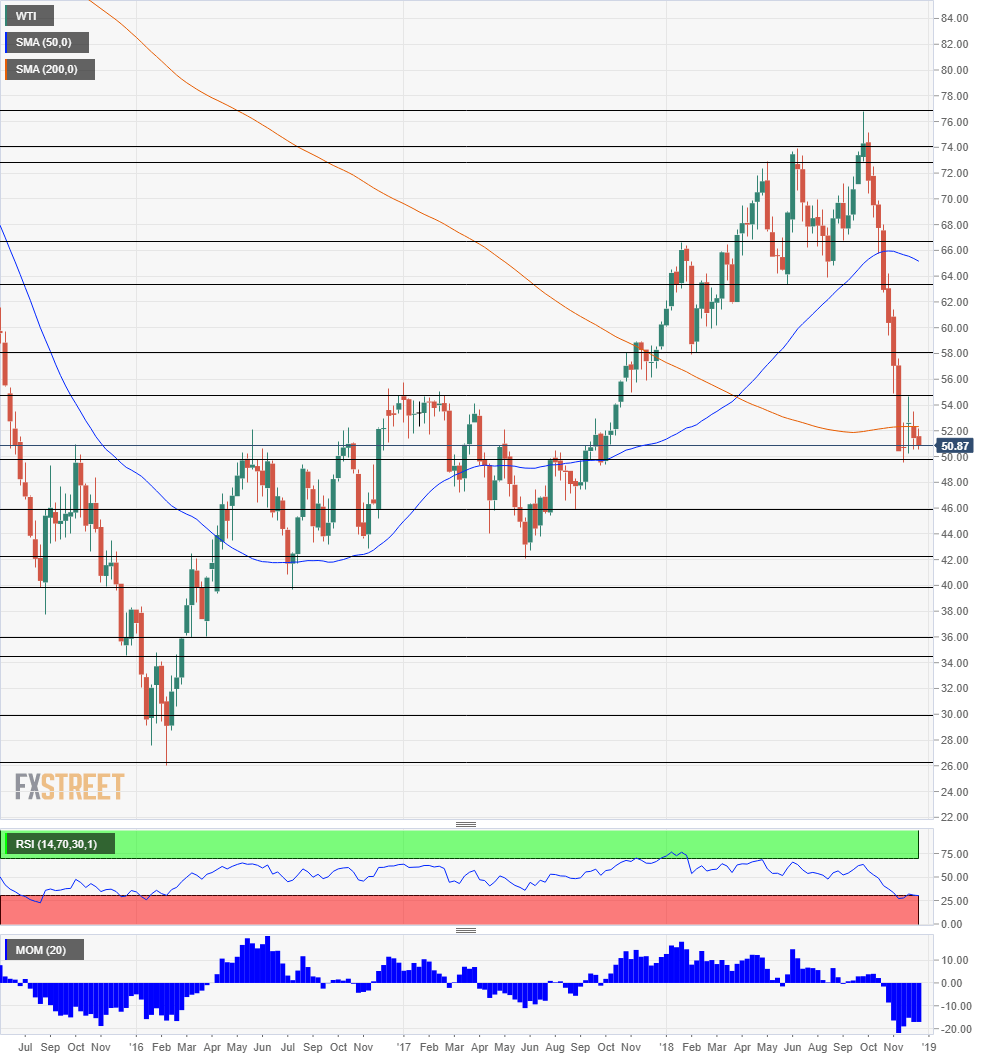
WTI fell below the 50 Simple Moving Average on the weekly chart. On the other hand, the sharp full sent the Relative Strength Index to just below 30, indicating oversold conditions. Momentum is pointing down.
All in all, the trend is for further falls, but perhaps after a correction according to the charts.
Here are the levels to watch from top to bottom. $76.80 was the high point of 2018. $74 capped WTI in late June. $72.80 capped the price in late May.
Significantly lower, $66.70 was a high point in January. $63.50 was a low point in June. $58.10 provided support in February.
$54.70 capped petrol prices in late November. $49.60 was the low point of the year, recorded close to its end.
The next levels are already from 2017. $46 was a low point in September. $42.30 was a low point in June 2017.
We are now back to 2016 with $39.70 as a low point in June of that year. $36.15 was a swing low in April 2016.
$34.50 was a swing low in late 2015. The round number of $30 is a critical low. The January 2016 low of $26.40 is the bottom of the barrel.
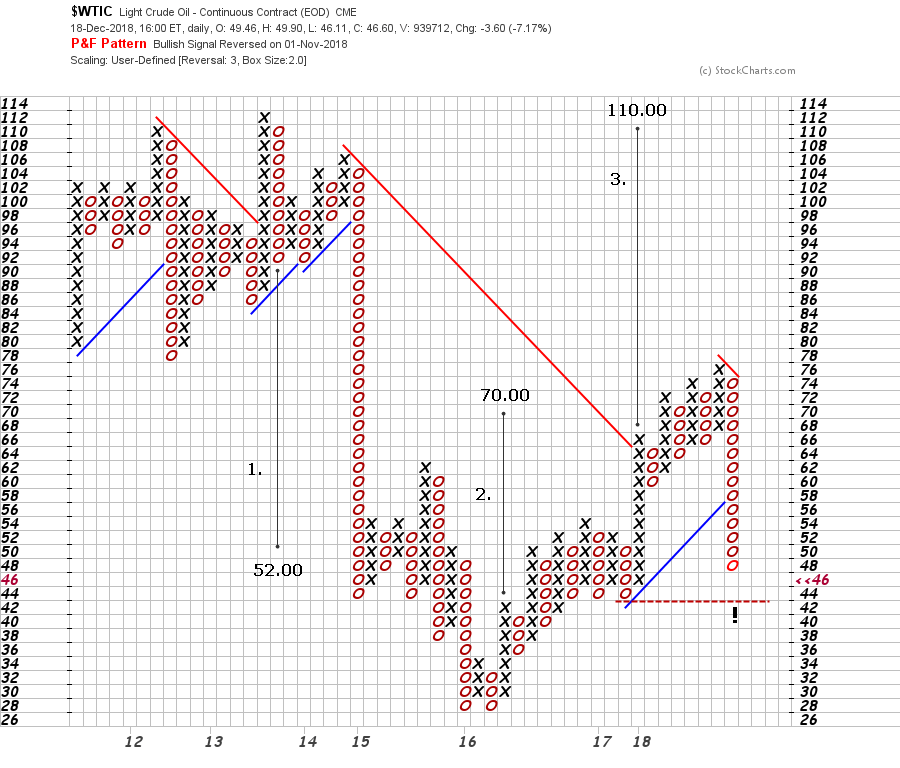
Oil Point & Figure Chart

In the oil market, we are faced with two price ranges: one the 100s and the other in the 50s separated by a strong down move carved at the end of 2015. From the top of 2013, a vertical downside count was established towards 52.00 which was filled in less than a year. On the opposite side, from the bottoms of 2016, a recovery from 30.00 to 42.00 suggested a potential move toward 70.00, achieved at the beginning of 2018. Now we deal with a potential upside projection to the upper range again (count 3.) unless the current column of Os breaks below the 44.00 level, in which case additional weakness would be expected.
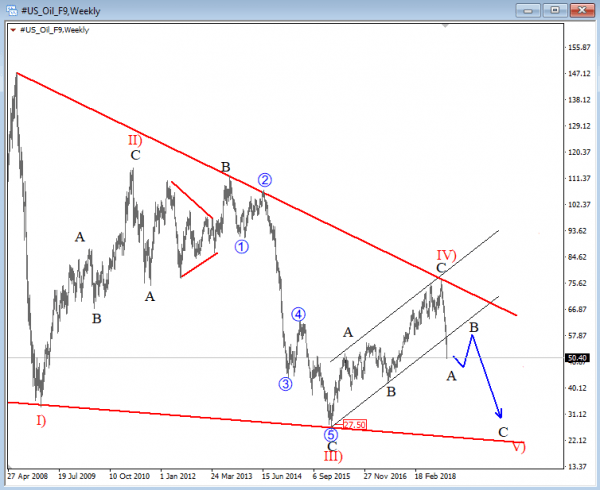
Oil Elliot Wave Analysis

CRUDE OIL is unfolding a bigger, bearish wedged structure that suggests more weaknes based on a sharp turn away from the upper red line at the end of 2018. Notice that recovery from 27.50 is in three waves, so whole corrective can be fully retraced, ideally that will happen with upcoming fifth wave back to 27.00 area.
Conclusion
Oil prices are unlikely to recover in 2019 but remain depressed due to lower demand and a supply glut. Volatility is also expected to be limited, mostly due to the flexibility of the US shale industry. There is always room for upside surprises, coming mostly from geoplitical instability.
Forecast Poll 2019
| Bullish | 16.6% |
|---|---|
| Bearish | 22.2% |
| Sideways | 61.1% |
| Average Forecast Price | 51.52 |
| EXPERTS | 1 YEAR |
|---|---|
| FXOpen team | 49.00 Sideways |
| Dmitriy Gurkovskiy | 34.50 Bearish |
| Brad Alexander | 55.00 Sideways |
| ForexGDP Team | 100.00 Bullish |
| Dmitry Lukashov | 78.00 Bullish |
| Chris Weston | 55.00 Sideways |
| Stoyan Mihaylov | 27.00 Bearish |
| Gregor Horvat | 37.00 Sideways |
| Joseph Trevisani | 60.00 Bullish |
| Ed Ponsi | 45.00 Sideways |
| HotForex Team | 55.00 Sideways |
| George Hallmey | 50.00 Sideways |
| Gianluca Privitera | 30.00 Bearish |
| Alberto Muñoz | 35.00 Bearish |
| Yohay Elam | 55.00 Sideways |
| Walid Salah El Din | 55.00 Sideways |
| OctaFx Analyst Team | 52.00 Sideways |
| Jeff Langin | 55.00 Sideways |
RELATED FORECAST 2019
EUR/USD: At the starting line of a long and bumpy road
GBP/USD: Imprisoned by Brexit darkness Sterling is set to chart a check mark
USD/JPY: A barometer of global growth and markets
AUD/USD: Collateral damage from the US-China trade war
USD/CAD: CAD comeback on the cards
USD/MXN: Volatility set to remain elevated
Gold: Focus on US real interest rates
Oil: Dwindling demand and substantial supply likely to pressure petrol
The United States Economy and Politics: The return to a bipolar world
The European Union Economy and Politics: Conflict at home
China and International Trade: The crossroads of a great power
Dollar Index: A stumble is not a fall
Author

Yohay Elam
FXStreet
Yohay is in Forex since 2008 when he founded Forex Crunch, a blog crafted in his free time that turned into a fully-fledged currency website later sold to Finixio.


