Gold Forecast 2019: Focus on US real interest rates

Gold may face bearish pressures, especially in the first half of 2019, as the real interest rates in the US are likely to rise.
The zero-yielding haven metal remained on the defensive for a major part of 2018, despite the US-China trade war, emerging market instability and political tensions in the Eurozone and Britain. That forced many to conclude that gold has lost its safe-haven appeal.
Moreover, the US dollar – gold's biggest nemesis – was the preferred safe haven during 2018. Gold, therefore, felt the pull of gravity, despite a host of risk-off issues across the globe.
2018 recap: Bears ruled the roost
Gold's price action in 2018 could be categorized as follows:
Key technical hurdle caps gain: Gold picked up a bid in January around $1,300, having established a bullish higher low pattern in December 2016 and December 2017. The ensuing rally, however, persistently failed to cut through the 100-month MA in three months to April.
Trump kicks off a trade war, gold takes a beating: The US imposed a 25 percent tariff on all steel imports on March 23. In retaliation, China imposed tariffs on 128 US products worth $3 billion. In the following four months to August, both sides kept imposing retaliatory tariffs, leading to risk aversion. Gold - a classic safe haven asset - fell sharply from $1,365 to $1,160 during the same time period.
Doubts emerge over the Fed's tightening path: The US central bank signaled that rates could rise three times in 2019. The markets never believed that hawkish forecast. As a result, the slope of the dollar rally flattened in late September and October. That helped gold move back above the $1,200 mark.
US-China trade tensions ease, curve inversion fears hurt USD: The haven demand for the US dollar dropped in the final quarter as the US-China trade tensions eased. Further, markets scaled back expectations of Fed rate hikes in 2019 on fears that the fiscal stimulus would wear off in 2019 and the economy could fall into recession. Moreover, a section of treasury curve (5s2s) inverted in November, triggering recession fears. All this helped gold stage a recovery rally to 200-day MA of $1,257.
As of writing, the yellow metal is trading at $1,245 - up 7.3 percent from the August low of $1,160, but still down 8.8 percent from the recent high of $1,365 seen in April.
What lies ahead?
US real rates set to rise in a gold-negative manner: Throughout 2018, President Trump criticized the Fed for pushing rates too high. Indeed the central bank has raised rates nine times in the last three years.
The real interest rates (adjusted for inflation), however, are still near zero. That could change in 2019, as most economists expect inflation (consumer price index) to drop next year, courtesy of cheap oil and gasoline and discounted online shopping.
The US central bank for one, expects annual inflation to dip from 2 percent to 1.9 percent at the end of 2018 and stay at that level by the end of next year. Moreover, the drop in the inflation could be bigger than expected if the US and China reach a permanent trade deal before March.
While price pressures are set to ebb, the borrowing costs are expected to rise next year. The Fed hiked rates by 25 basis points yesterday, but also signaled that interest rates could rise by 50 basis points in 2019. Notably, the Fed is seen hiking rates by 25 basis points in March and June and could pause for the rest of the year.
Indeed, the Fed will likely pause rate hikes in the first half, if the global and US economy slows more-than-expected. A deeper slowdown, however, could yield bigger drop inflation. So, the case for a rise in real interest rates looks strong. That is bad news for zero-yielding safe-haven assets like gold.
Also, the dollar will likely pick-up a haven bid if the US economy continues to hold strong amid signs of stress in the global economy.
Factors that could support gold in 2019
Real rates turn negative: Gold tends to perform well when the inflation rate is higher than the nominal interest rate. Inflation may rise well above interest rates if the US-China trade war escalates, restoring gold's appeal as a store of value.
US economy underperforms: The haven flows into the US seen in 2018 will likely reverse, pushing the yellow metal higher, if the world's largest economy underperforms the global economy.
Market volatility: Hedging demand for gold may rise if the equities, commodities and EM currencies remain volatile.
Technical Analysis:
Monthly chart favors the bears
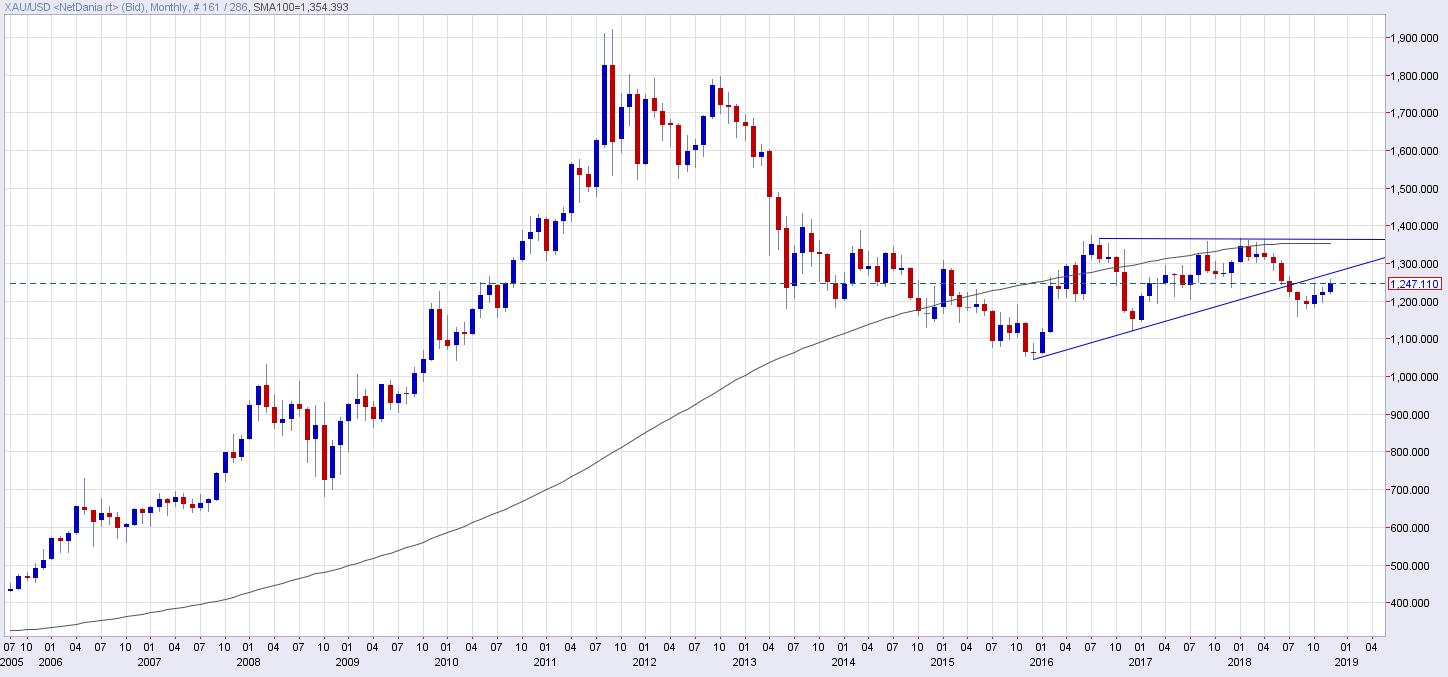
As seen above, gold breached the ascending triangle in July, signaling an end of the rally from the December 15 low of $1,046.
The bearish view put forward by the triangle breakdown will remain valid as long as prices are trading below the resistance of the lower edge of that triangle, currently at $1,285.
Meanwhile, the 100-month MA of $1,354 is the level to beat for the bulls. A convincing move above that would open up upside toward $1,500.
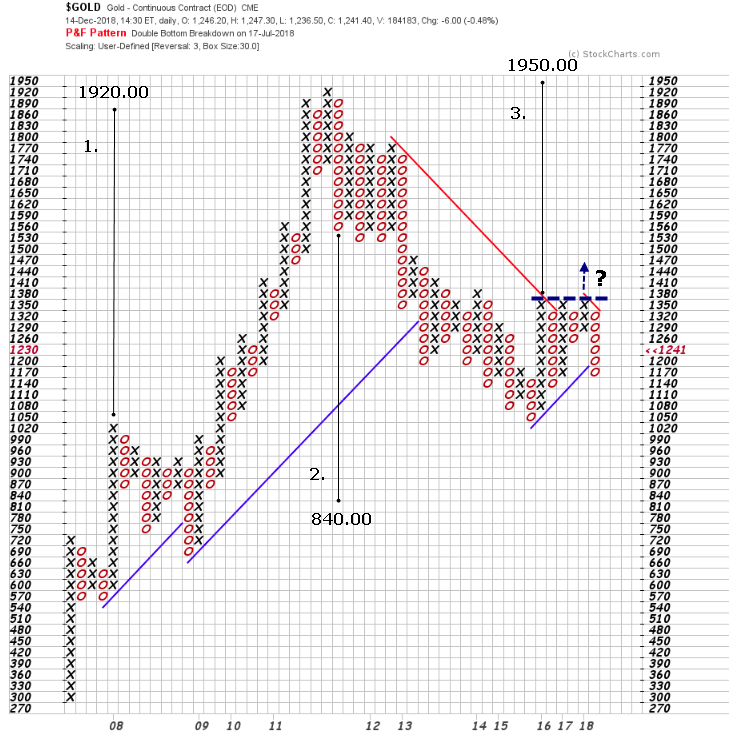
Gold Point & Figure Chart

From the 2011 highs, -previously projected from the continuation move in 2008 (count 1.)-, the price of gold in US dollars started looking bumpy until it finally collapsed in 2012. The first of these severe flip-flops from the 1920.00 high established a downside count (2.) towards the 840.00 level. There is a chance this unfilled target becomes a reality in the near future. A significant technical damage to gold's entrenched bear trend was inflicted when its price refused to print a tipple-top buy signal at 1380.00 during 2018. Bullish count 3. remains active whilst above 1050.00 with a target of 1950.00.
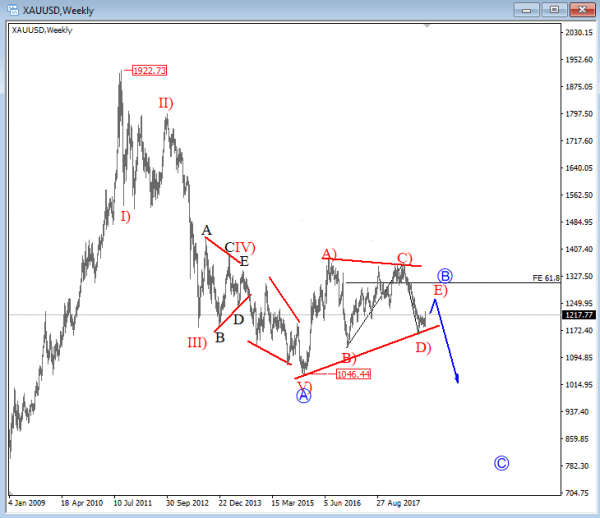
Gold Elliot Wave Analysis

GOLD is trading bearish when observing the whole decline from 1922, but mostly sideways for the last three years, which we see is as part of a corrective movement within a big triangle in wave B of a three-wave A-B-C bearish reversal from all-time highs. It can be approaching the final leg E) of a triangle, which can look for a bearish continuation in 2019. That said, we believe that GOLD may drop below 1000 level in the upcoming months, before we may consider any bullish scenarios!
Forecast Poll 2019
| Bullish | 52.6% |
|---|---|
| Bearish | 15.8% |
| Sideways | 31.6% |
| Average Forecast Price | 1394.02 |
| EXPERTS | 1 YEAR |
|---|---|
| FXOpen team | 1250.50 Sideways |
| Dmitriy Gurkovskiy | 980.00 Bearish |
| Brad Alexander | 1380.00 Bullish |
| ForexGDP Team | 1500.00 Bullish |
| Dmitry Lukashov | 1370.00 Bullish |
| Chris Weston | 1370.00 Bullish |
| Stoyan Mihaylov | 1500.00 Bullish |
| Gregor Horvat | 1070.00 Bearish |
| Chris Svorcik | 1550.00 Bullish |
| Joseph Trevisani | 1100.00 Bearish |
| Neerav Yadav | 1480.00 Bullish |
| HotForex Team | 1300.00 Sideways |
| George Hallmey | 2645.00 Bullish |
| Alberto Muñoz | 1375.00 Bullish |
| Walid Salah El Din | 1330.00 Sideways |
| OctaFx Analyst Team | 1230.00 Sideways |
| Jeff Langin | 1200.00 Sideways |
| Michael Pento | 1559.00 Bullish |
| National Australia Bank | 1297.00 Sideways |
RELATED FORECAST 2019
EUR/USD: At the starting line of a long and bumpy road
GBP/USD: Imprisoned by Brexit darkness Sterling is set to chart a check mark
USD/JPY: A barometer of global growth and markets
AUD/USD: Collateral damage from the US-China trade war
USD/CAD: CAD comeback on the cards
USD/MXN: Volatility set to remain elevated
Oil: Dwindling demand and substantial supply likely to pressure petrol
The United States Economy and Politics: The return to a bipolar world
The European Union Economy and Politics: Conflict at home
China and International Trade: The crossroads of a great power
Dollar Index: A stumble is not a fall
Author

Omkar Godbole
FXStreet Contributor
Omkar Godbole, editor and analyst, joined FXStreet after four years as a research analyst at several Indian brokerage companies.


