- Deciphering the Fed
- Look Ahead: Stocks
- Look Ahead: Commodities
- Data Highlights
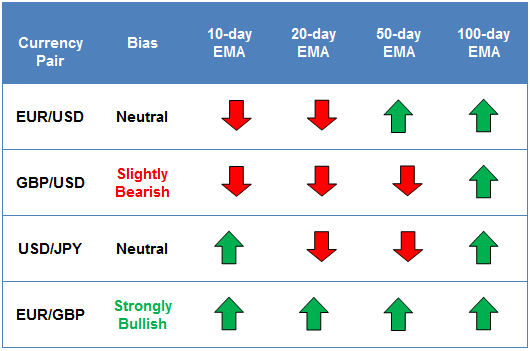
- EUR/USD back below bullish channel and 1.3825 level
- GBP/USD oversold, testing 61.8% Fib support at 1.6470
- USD/JPY consolidating in the middle of recent 101.00-103.50 range
- EUR/GBP still in play, bullish bias intact above 20-day EMA
* Bias determined by the relationship between price and various EMAs. The following hierarchy determines bias (numbers represent how many EMAs the price closed the week above): 0 – Strongly Bearish, 1 – Slightly Bearish, 2 – Neutral, 3 – Slightly Bullish, 4 – Strongly Bullish.
** All data in this section as of approximately 4:00pm GMT Friday **
EUR/USD
- EUR/USD dropped sharply after FOMC on Wednesday
- MACD turning down for the first time in six weeks
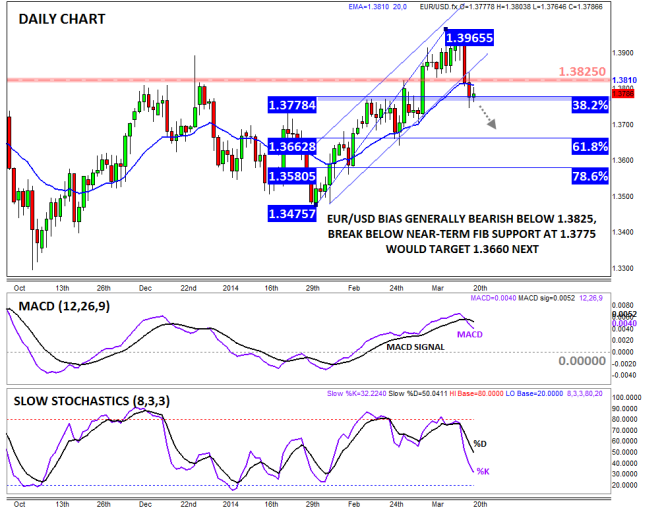
- Bias now bearish below key 1.3825 level
The EUR/USD inched higher early last week before reversing sharply to the downside after the Fed outlined a more hawkish view on Wednesday. Looking to the chart, last week’s drop broke the previous bullish channel in the pair, taking rates below the key 1.3825 level in the process. Bolstering the bearish case, the MACD has crossed below its signal line for the first time in six weeks, showing a shift to bearish momentum in the pair. For this week, a bearish bias in the pair is favored as long as rates remain below the key 1.3825 level, with near-term support expected at the Fibonacci retracements of the February/March rally. For more on the EUR/USD, see Thursday’s article “EURUSD: Watch Shifting Current Account Dynamics”.
GBP/USD
- GBP/USD finally broke below 1.6600-1.6750 range
- MACD still bearish, but Slow Stochastics in oversold territory
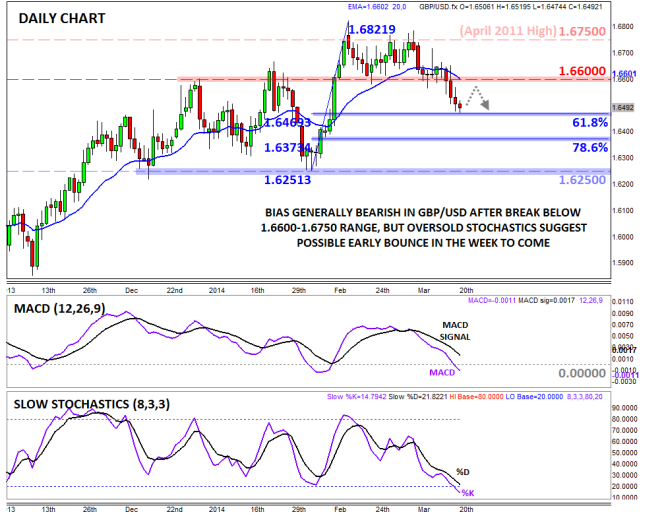
- Potential for a bounce off 1.6470 support early this week, but bias still bearish
The GBP/USD finally broke out of its 1-month range from 1.6600 to 1.6750 last week, quickly continuing down to test support at 1.6470, the 61.8% Fibonacci retracement. At this point, the Slow Stochastics are in oversold territory so a bounce of support this week is a definite possibility. Nonetheless, the MACD shows continued bearish momentum, so the market may look to fade any early week bounces in the pair. After putting a floor under the unit for the past month, the 1.6600 level is likely to provide a ceiling if rates rally.
USD/JPY
- · USD/JPY recovered off support in the lower-101.00s last week
- · MACD and Slow Stochastics show balanced, two-way trade
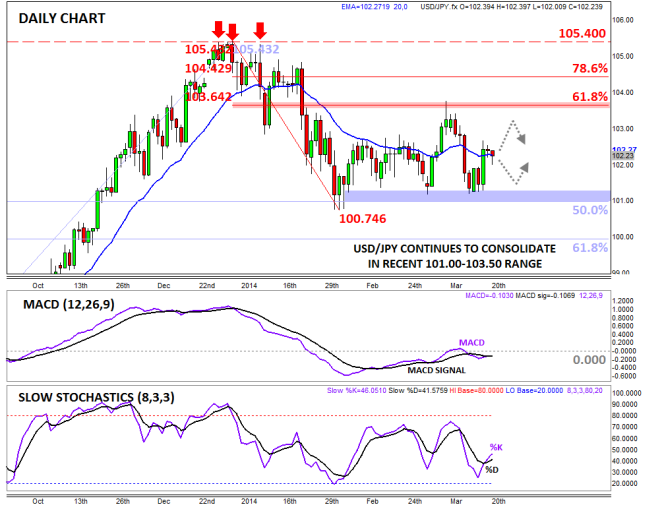
- · Overall bias still neutral as rates consolidate within 101.00-103.50 range
The USD/JPY recovered off support in the lower-101.00s last week, helped along by the relatively hawkish Fed announcement on Wednesday. Taking a step back, the pair is essentially unchanged from where it was trading at the beginning of February, and rates have been generally trapped within a range from 101.00 up to about 103.50 for the past seven weeks now. As you might expect in a range-bound market, both the MACD and Slow Stochastics are indicating balanced, two-way trade, and the 20-day MA has essentially flatlined. For this week, a neutral bias is appropriate, and traders may look to fade, or bet against, any move toward the edge of this range.
EUR/GBP
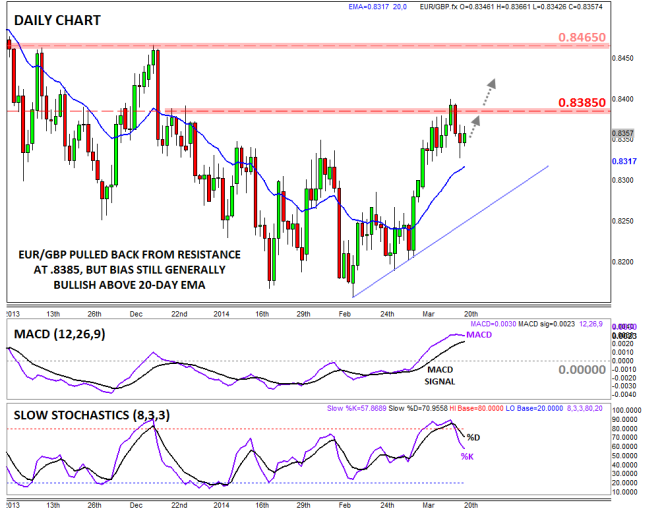
- EUR/GBP stalled out against resistance at .8385 last week
- MACD remains bullish, Slow Stochastics no longer overbought
- Bias remains bullish above the 20-day EMA
For the second consecutive week, the EUR/GBP is our currency pair in play this week due to a number of major data releases from the European continent, including Flash PMI figures from Europe and German IFO data, along with CPI, Retail Sales, and Current Account data from the UK. From a technical perspective, the EUR/GBP rally stalled out against resistance near .8385 last week before pulling back in the latter half of the week. The MACD continues to trend higher above its signal line and the “0” level, and last week’s pullback has taken the Slow Stochastics out of overbought territory, potentially clearing the path for another leg higher. For this week, the general bullish bias is intact as long as the pair holds above its 20-day EMA. For more on EUR/GBP, see Friday’s note “One to Watch: EURGBP – Where Could This Pair Go Next?”)
Deciphering the Fed
The jury is out on Janet Yellen’s first press conference as Fed governor. After her comments were initially interpreted as being hawkish, as we ended last week the market seemed to reconsider and the S&P 500 broke to a fresh record high. There is still a debate going on as to what Yellen was trying to say and do last Wednesday: the hawks think the Fed was signalling a shorter period of time from when tapering stops and rate hikes start, the doves are putting it down to Yellen’s nervousness at her first meeting. In reality it is probably a bit of both.
Post the Fed press conference, a slew of dovish Fed members including Minneapolis Kocherlakota were out in force reiterating the need for caution when it came to rate rises. Kocherlakota, who dissented at the Fed meeting, said on Friday that he wanted the unemployment rate threshold for forward guidance revised lower to 5.5% and a 2.25% inflation rate. While Kocherlakota appears to be on the extreme end of dovishness at the Fed, it does highlight the wide range of views on the Federal Reserve right now. Although Yellen is also considered one of the Fed’s doves, she has to represent the views of the entire committee, which may explain her “slip up” last week.
Overall, we would argue that the balance of opinion at the Fed is quite centrist right now, and the balance of members (6 out of 11) is in the middle between Yellen, Kocherlakota and Dudley (the doves) and Plosser and Fisher (the hawks). Last week’s extreme reaction to Yellen’s remarks and then subsequent reversal suggest that Fed expectations continue to dominate the market focus, even though Russia/Ukraine tensions and China fears continue to bubble away in the background.
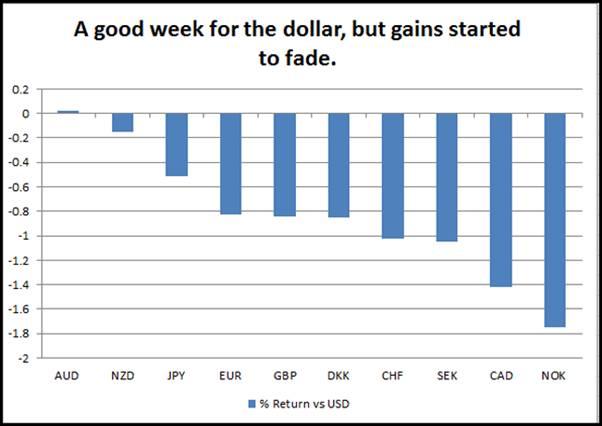
So what does this all mean for the markets? The reaction in the FX market was more nuanced and less correlated to other markets, so even though US stocks managed to rally to fresh record highs, risky FX was not moving in unison. The reason was the mixed performance of the dollar; the buck did well against the NOK, CAD and SEK, while its performance was more muted against the AUD, NZD and JPY, as you can see in the chart below.
While stocks seem happy to grind higher, the reaction in the FX market suggests that it has been driven by domestic fundamentals and relative interest rate expectations as well as subdued moves in US Treasury yields. Although the Fed signalled that it plans to raise rates to 1% by end of 2015, from 0.75% in its December forecast, Treasury yields failed to break above 2.8% and are still at their average rate of 2014 so far, around 2.75%. This is limiting dollar upside and the capped losses for the EUR and GBP at the end of last week.
From a technical perspective, see our Market Movers section for more. The dollar index managed to cling on above the crucial 80.00 level, however after the initial surge of enthusiasm for the dollar post the FOMC press conference, sentiment started to fade by the end of the week. Dollar bulls may have been disappointed that DXY failed to get above a cluster of moving average resistance between 80.35 – 50, which suggests some reluctance to go long the dollar in the current environment.
Looking forward to this week, the plethora of Fed speakers, including the dovish Bullard and Evans, could temper Yellen’s comments, which may erode the remnants of dollar support. Overall, we tend to think that the choppy ranges that have persisted in the FX space for most of this year will continue as fundamentals take centre stage, so traders should grab their economic calendars and ensure they do their homework, like reading this report.
Look Ahead: Stocks
Investors have shrugged off concerns over a hawkish Federal Reserve and also fresh sanctions over Russia; at the time of writing Friday morning, global stock markets were higher across the board, although so too were gold and Brent crude oil prices. In fact, US equities have had a decent week so far, with the S&P 500 rising in 4 out of the past 5 sessions. Investor sentiment is clearly bullish as we head into the next week. However the situation in Ukraine poses the greatest risk to equities in the near term, so the outlook could easily change if the situation there deteriorates over the weekend.
What’s more, concerns over China could make a spectacular return should Monday’s HSBC manufacturing PMI disappoint expectations. The report is expected to edge a touch higher from the 48.5 reading it printed last month. There will also be a batch of manufacturing PMIs from around Europe on Monday, followed by the German Ifo, US consumer confidence and new home sales on Tuesday. So, the start of the next week could well be very interesting and not just for equities, but risk assets in general.
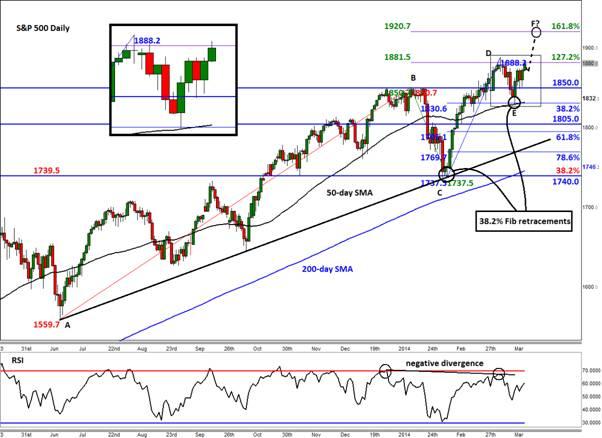
The technicals meanwhile point towards more gains, as highlighted by the progressively shallow pullbacks recently. As can be seen on the daily chart of the S&P, below, the sell-off at the start of the year only managed to pull back to the 38.2% Fibonacci retracement level (i.e. 1740 at point C) of the last major upswing (from point A to B). This relatively shallow retracement correctly pointed to more gains: not only did the index break above the old high of 1850, but it also went on to reach the 127.2% Fibonacci extension level (point D) of that resulting sell-off (i.e. BC swing).
But the S&P retreated from there as the recent turmoil in Ukraine encouraged further profit-taking, which momentarily caused the index to break below 1850. Again, this latest pullback failed to penetrate deeper than the 38.2% Fibonacci level (this time of the CD swing at 1830 – point E), which suggests that most existing buyers are likely to have remained in the game. If the bulls continue to defend this level then not only could we see a potential rally towards 1920 (i.e. the 161.8% Fibonacci extension level of that BC swing), but the index may even break above it at some point in the near future. On the other hand, should the index drop below 1830 (point E), then we would expect to see some near-term losses.
Look Ahead: Commodities
Both the major crude oil contracts were trading higher on Friday afternoon with WTI also in the positive territory for the week. However Brent was still in the red for the week, although it had eroded a good chunk of the losses suffered earlier in the week when oil prices slipped as concerns over Ukraine eased while the dollar rallied – which pressured all the buck-denominated commodities – after Janet Yellen surprisingly hinted at the timing of Federal Reserve’s first interest rate hike at the FOMC press conference. Responding to a question regarding how much time would elapse between QE’s end and interest rate hikes, she said “about six months” – a lot sooner than most traders had expected. Some questions marks have since been raised in terms of what Yellen actually meant as she did, in fairness, mention the usual caveats in that comment.
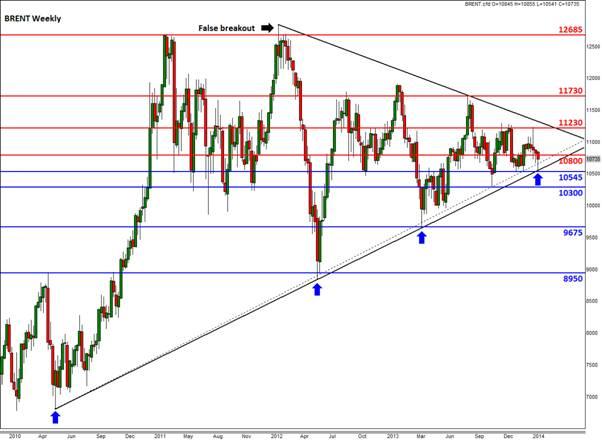
The Brent oil contract has already reached the February low of around $105.40, as we pointed out it might on Monday after Russia called the West’s bluff over Crimea. That resulted in the break of a 1-year old uptrend. However, as can be seen on the weekly chart of Brent (below), a much longer-term bullish trend line has managed to hold firm on a combination of short-side profit taking and possibly some buying interest, too. Interestingly, this trend line came in right at the February low point which further enhanced the chance for a bounce there. While a break below this $105.40 mark would clearly be a bearish development, it is worth pointing out that some of the supply risks remain high while demand in China appears to have grown where refineries processed record amounts of crude in February i.e. 10.5 million barrels per day.
WTI crude oil has meanwhile remained fairly stable in recent days. Investors are torn by the overall increases in US oil inventories and the destocking in Cushing, Oklahoma, where WTI is priced. Indeed, the EIA’s data on Wednesday revealed that there was an overall build of 5.9 million barrels in oil inventories last week. This was more than 2.4m expected, but in line with API's estimate from Tuesday night. However, stocks at Cushing decreased by a further 1 million barrels while distillate inventories fell by 3.1 million – significantly more than expected. This has also prevented WTI from falling. However, the destocking of crude at Cushing and the recent distillate oil drawdowns are only likely to be temporary. Once these pressures abate, the focus may well turn back to the excess supply of oil in the US where production has reached the highest level since 1988. What’s more, the 4-week average of oil imports has fallen to the lowest in more than 17 years, suggesting it is indeed the rise in domestic oil production that has caused inventories to build.
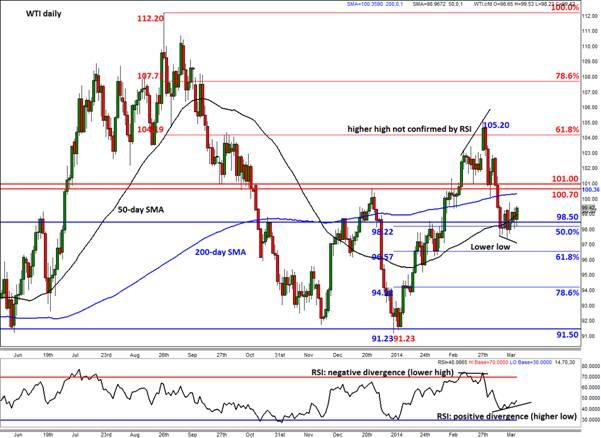
Meanwhile on the technical front, the Relative Strength Index (RSI) has created a positive divergence with WTI prices i.e. the momentum indicator has made a higher low despite WTI forming a (mini) lower low recently. This suggests that the bearish momentum is fading and that we could see some more gains in early next week. The key levels to watch on the upside are $100.35 – the 200-day moving average – followed by $100.70/$101.00, an area which was formerly support.
Data Highlights
Monday, March 24, 2014
1:45 GMT Preliminary HSBC Manufacturing PMI in China
- China has become a global concern for investors as the Chinese government is allowing some of their unhealthy businesses to default on their corporate bonds. The risk wary sentiment could be exacerbated if Chinese data continues to struggle. This measure has dropped below the 50 growth/retraction level for two straight months and is expected to do so again upon this release. Since nobody expects this to be all that great, much of the skepticism could be priced in, so if it jumps back above 50 a relief rally in risk could take hold.
9:00 GMT Flash PMI’s (March)
- The Eurozone, France and Germany will release the first readings of March PMI data first thing on Monday morning. On their own these surveys tend to have a fleeting impact on the EUR, but if they act in unison and suggest either strengthening or weakening conditions for the Eurozone’s economy, then we could see some volatility for the single currency. It’s worth watching France closely, as it is one of the last member states to have readings below 50. A break back into expansionary territory could be EUR positive.
Tuesday, March 25, 2014
0930 GMT UK CPI
- UK inflation data is expected to show that consumer prices fell further in February to 1.7% from 1.9%. A decline in price pressures is expected by the BOE; however it could weigh on the pound.
14:00 GMT Conference Board’s US Consumer Confidence
- Despite the less than expected result achieved by last month’s CB Consumer Confidence, it was still in the top half of figures over the last 12 months and the second highest since the October 2013 release. Weather has been a depressing factor over the last couple months in everything from housing to employment, but surprisingly consumer confidence has improved slightly during the winter months. Since negative data has so vociferously been blamed on weather, confidence could remain high as a bounce back in the economy is expected.
Wednesday, March 26, 2014
7:00 GMT Reserve Bank of Australia Governor Glenn Stevens Speaks
- Scheduled to speak at the Credit Suisse Asian Investment Conference in Hong Kong, Stevens will be providing his outlook for the Australian and global economies in 2014. Stevens has, in the past, discussed specific levels to which he feels the AUD is properly valued (0.85), which has reversed the rising trend in the currency, and I wouldn’t put it past him to do the same in this circumstance. Since switching the RBA’s policy stance to more neutral from dovish, the AUD/USD has meandered well above the 0.90 figure. Watch for some jawboning from this speech in an effort to get it back below that figure.
13:30 GMT US Durable Goods Orders
- While not as economically viable as the Retail Sales report, Durable Goods Orders often times creates volatility on its relative inability to be predicted. Consensus estimates have been historically inaccurate including last month’s forecast being 1.2% less than the actual result. Since weather has been such a scapegoat for economic misses over the last couple months, any positive result would probably be looked upon as a confirmation of the weather depression theory and more USD strength.
21:45 GMT NZ Trade Balance
- Surprisingly, the Kiwi GDP that came out this past week was less than expectations, a deviation from the typically world beating figures from the nation. In defense of the data though, it was GDP data from Q4 2013, and was already baked in and trumped by more recent data. Regardless, NZ Trade has been healthy the last three months as it has returned to surplus after four straight months of deficit. If the current trend can continue, watch for the NZD/USD to reverse USD strength set forth by the Fed this past week.
23:50 GMT Japanese Retail Sales
- Most Japanese economic data is widely panned as the only thing that seems to move its currency is action from the Bank of Japan or political theater, but this release could be one of the outliers. Japan is ready to institute a sales tax increase at the beginning of next month, so there will likely be a jump in retail purchases ahead of the increase to save money. Last month’s 4.4% increase was the best result in almost two years, and if the anecdotal theory of increased activity to get ahead of the tax is correct, this month’s result could be even better.
Thursday, March 27, 2014
9:00 GMT Norway announces interest rates
- Interest rates are expected to be left unchanged by the Norges Bank this month, after a strong 0.6% rate of quarterly growth in Q4. Added to this, the Bank has urged caution as it tries to manage a deflating housing bubble, which suggests they may err on the side of dovishness.
9:30 GMT UK Retail Sales
- UK retail sales are expected to show a recovery for February after a weak January reading. This data could show some pent-up consumer demand after bad weather at the start of the year. Overall, the market is expecting a solid reading for last month, and expectations are that January’s sales miss was a one-off.
15:00 GMT Pending Home Sales
- Housing growth releases in the US have been mixed so far this month with Building Permits rising, Existing Home Sales declining, and Housing Starts remaining stagnant; you can’t get any more even than that. New Home Sales will be released earlier in the week and could be a good guide on how strong the sector is at this point in time which will likely shape expectations more than anything else. However, Pending Home Sales have missed consensus for seven straight months, highlighted by the 8.7% decline released on January 30th, but has been blamed on weather for the most part. If there is a weather-related boost for the US economy, it could show up here most glaringly.
Friday, March 28, 2014
9:30 GMT UK National Accounts data
- The market expects an improvement in the UK current account balance, which could be important for sterling. The report printed a GBP 20.7bn deficit for 3Q, which is the highest reading since 1989. Since current account data is important for the FX market, this is one reason why the pound may have suffered in recent weeks. Another weak quarter of current account data could weigh heavily on the pound.
10:00 GMT Eurozone confidence indicators
- We expect confidence to have plunged in March due to on-going Russian/Crimean fears; however the market has been able to brush off concerns of Russian aggression so weak results may not have a major impact on the markets.
General Risk Warning for stocks, cryptocurrencies, ETP, FX & CFD Trading. Investment assets are leveraged products. Trading related to foreign exchange, commodities, financial indices, stocks, ETP, cryptocurrencies, and other underlying variables carry a high level of risk and can result in the loss of all of your investment. As such, variable investments may not be appropriate for all investors. You should not invest money that you cannot afford to lose. Before deciding to trade, you should become aware of all the risks associated with trading, and seek advice from an independent and suitably licensed financial advisor. Under no circumstances shall Witbrew LLC and associates have any liability to any person or entity for (a) any loss or damage in whole or part caused by, resulting from, or relating to any transactions related to investment trading or (b) any direct, indirect, special, consequential or incidental damages whatsoever.
Recommended Content
Editors’ Picks
EUR/USD eases to near 1.0700 ahead of German inflation data

EUR/USD is paring gains to near 1.0700 in the European session on Monday. The pair stays supported by a softer US Dollar, courtesy of the USD/JPY sell-off and a risk-friendly market environment. Germany's inflation data is next in focus.
USD/JPY recovers after testing 154.50 on likely Japanese intervention

USD/JPY is recovering ground after sliding to 154.50 on what seemed like a Japanese FX intervention. The Yen tumbled in early trades amid news that Japan's PM lost 3 key seats in the by-election. Focus shifts to the US employment data and the Fed decision later this week.
Gold price holds steady above $2,335, bulls seem reluctant amid reduced Fed rate cut bets

Gold price (XAU/USD) attracts some buyers near the $2,320 area and turns positive for the third successive day on Monday, albeit the intraday uptick lacks bullish conviction.
Ripple CTO shares take on ETHgate controversy, XRP holders await SEC opposition brief filing

Ripple loses all gains from the past seven days, trading at $0.50 early on Monday. XRP holders have their eyes peeled for the Securities and Exchange Commission filing of opposition brief to Ripple’s motion to strike expert testimony.
Week ahead: FOMC and jobs data in sight

May kicks off with the Federal Open Market Committee meeting and will be one to watch, scheduled to make the airwaves on Wednesday. It’s pretty much a sealed deal for a no-change decision at this week’s meeting.
