Mideast war takes bite out of market

USD: Jun '24 is Up at 106.065.
Energies: May '24 Crude is Down at 85.04.
Financials: The June '24 30 Year T-Bond is Down 9 ticks and trading at 114.00.
Indices: The Jun '24 S&P 500 emini ES contract is 6 ticks Higher and trading at 5105.75.
Gold: The Apr'24 Gold contract is trading Up at 2388.90.
Initial conclusion
This is not a correlated market. The USD is Up and Crude is Down which is normal, but the 30 Year T-Bond is trading Lower. The Financials should always correlate with the US dollar such that if the dollar is Higher, then the bonds should follow and vice-versa. The S&P is Higher and Crude is trading Lower which is correlated. Gold is trading Higher which is not correlated with the US dollar trading Up. I tend to believe that Gold has an inverse relationship with the US Dollar as when the US Dollar is down, Gold tends to rise in value and vice-versa. Think of it as a seesaw, when one is up the other should be down. I point this out to you to make you aware that when we don't have a correlated market, it means something is wrong. As traders you need to be aware of this and proceed with your eyes wide open. All of Asia is trading Lower. Currently all of Europe is trading Lower as well.
Possible challenges to traders
-
Building Permits are out at 8:30 AM EST. This is Major.
-
Housing Starts are out at 8:30 AM EST. This is Major.
-
FOMC Member Jefferson Speaks at 9 AM EST. This is Major.
-
Industrial Production m/m is out at 9:15 AM EST. This is Major.
-
Capacity Utilization Rate is out at 9:15 AM EST. This is Major.
Treasuries
Traders, please note that we've changed the Bond instrument from the 30 year (ZB) to the 10 year (ZN). They work exactly the same.
We've elected to switch gears a bit and show correlation between the 10-year bond (ZN) and the S&P futures contract. The S&P contract is the Standard and Poor's, and the purpose is to show reverse correlation between the two instruments. Remember it's likened to a seesaw, when up goes up the other should go down and vice versa.
Yesterday the ZN migrated Higher at around 10:30 AM EST as the S&P hit a High at around the same time. If you look at the charts below the S&P gave a signal at around 10:30 AM and the ZN started its Upward climb. Look at the charts below and you'll see a pattern for both assets. S&P hit a High at around 10:30 AM and migrated Lower. These charts represent the newest version of MultiCharts and I've changed the timeframe to a 15-minute chart to display better. This represented a Long opportunity on the 10-year note, as a trader you could have netted about 20 ticks per contract on this trade. Each tick is worth $15.625. Please note: the front month for both the ZN and the S&P are now Jun '24. I've changed the format to filled Candlesticks (not hollow) such that it may be more apparent and visible.
Charts courtesy of MultiCharts built on an AMP platform
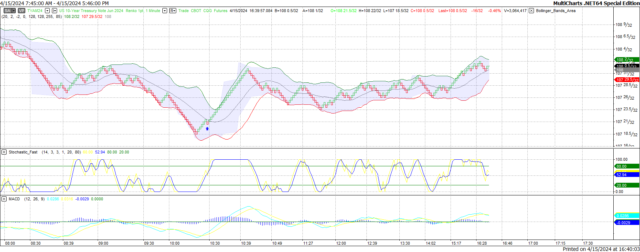
ZN -Jun 2024 - 04/15/24
-638488662856916775.png)
S&P - Jun 2024 - 04/15/24
Bias
Yesterday we gave the markets an Upside bias. The markets had other ideas and dropped dramatically. The Dow dropped 248 points and the other indices lost ground as well. Today we aren't dealing with a correlated market and our bias is Neutral.
Could this change? Of Course. Remember anything can happen in a volatile market.
Commentary
Yesterday was a huge surprise as we didn't expect the markets to be rising or oil not climbing about $100 a barrel but both were true which is why we claimed an Upside bias. That plus the USD and the Bonds were Lower and that's usually a good indication of an Upside day. Initially the markets did leap Higher but by the afternoon it was clear that the markets were heading Lower. In the markets they say "perception becomes reality" and yesterday was no exception to the rule. The perception is the markets should eb heading Lower based upon what hppened over the weekend and thus the markets migrated Lower. Why did they rise initially? Because Israel didn't counterattack Iran, but everyone knows Israel will demand their "pound of flesh." We shall see how events unfold.
Author

Nick Mastrandrea
Market Tea Leaves


