Markets lack direction ahead of key risk events

Market Overview
Traders seem to be jostling for position with several key risk events in the near future but nothing definitive to provide markets with decisive direction. In the course of the next week, there will be a crucial ECB monetary policy meeting, Q3 US growth data and Donald Trump’s decision for the next chair of the Federal Reserve’s FOMC being “very, very close”. As a result there is an indecisive look to markets. Treasury yields and the dollar has slipped a touch whilst the euro and gold have rebounded, however, nothing that would suggest a trend changing move. This could become a feature of trading in the coming days at least until Thursday’s ECB meeting. There was finally a slip on Wall Street last night in the wake of disappointing results from GE. Although minor corrections have tended to be seen as a chance to buy, this could filter into the European session today. European equities have struggled of late, not buoyed as Wall Street has been by the promise of tax reform.

Wall Street dropped back with the S&P 500 -0.4% at 2565, and whilst Asian markets were mixed to slightly higher (Nikkei +0.5%), European markets are taking the lead from Wall Street early today. In forex the slip on the dollar into the close last night has been held today but with very little real direction. The big mover has been the New Zealand dollar which continues to suffer amidst the socialist policy agenda of the new Labour government being laid out. In commodities, gold is mixed whilst oil is also trading around the flat line in early moves.
Traders will be keeping an eye on the flash PMIs for both manufacturing and services the Eurozone and US today, meaning the euro and US dollar could be impacted. Through the early part of the European session the individual Eurozone countries announce before the flash Eurozone Manufacturing PMI at 0900BST expected to dip slightly to 57.9 (from 58.1 as a final reading last month) whilst the flash Eurozone Services PMI is expected to tick down to 55.7 (from 55.8). This means that the flash Eurozone Composite PMI is expected to drop slightly to 56.5 (from 56.7 last month) The US flash PMIs are at 1445BST with flash US Manufacturing PMI expected to improve slightly to 53.3 (from 53.1 last month), whilst the flash US Services PMI is expected to be slightly lower at 55.2 (down from 55.3 last month). This is interesting again, given how strong both the ISM Manufacturing and Non-Manufacturing readings were a few weeks ago. The Richmond Manufacturing Index is at 1500BST and is expected to dip slightly to +17 (from +19) but this remains a strong number.
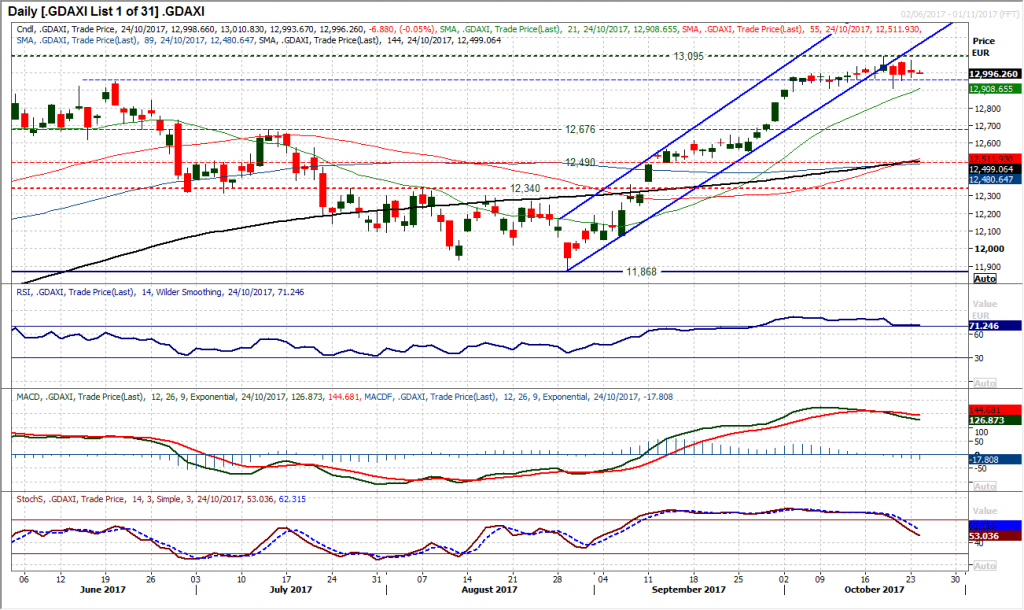
Chart of the Day – DAX Xetra
Global equity markets have been pushing higher in recent weeks and dragged higher by ever more all-time highs on Wall Street, the DAX has managed a break above 13,000. However the bulls are by no means having it all their own way. The support of a seven week uptrend on the DAX was breached last week as the bulls have begun to look increasingly tired. Having posted an all-time high of 13,095 last week the negative candles are beginning to rack up. Another failed intraday move above 13,000 adds to the building questions of the sustainability of this run higher. The momentum indicators are positing a series of sell signals now with the MACD lines crossing lower, the Stochastics confirming a sell signal. If the RSI were to now close below 70 is would be a full set. Ultimately it is the price which drives market moves and the support is holding firm around 12,910, whilst there also seems an appetite to support above the old key breakout from June at 12,951. The hourly chart shows a mixed near term outlook with a trading band of 185 ticks. Breakout would imply 185 ticks in the direction of the break and given the positive outlook for global markets remains in play, this flies in the face of corrective momentum indicators. With such choppy and mixed moves, look to trade the break. Initial support is 12,956 and resistance at 13,069.
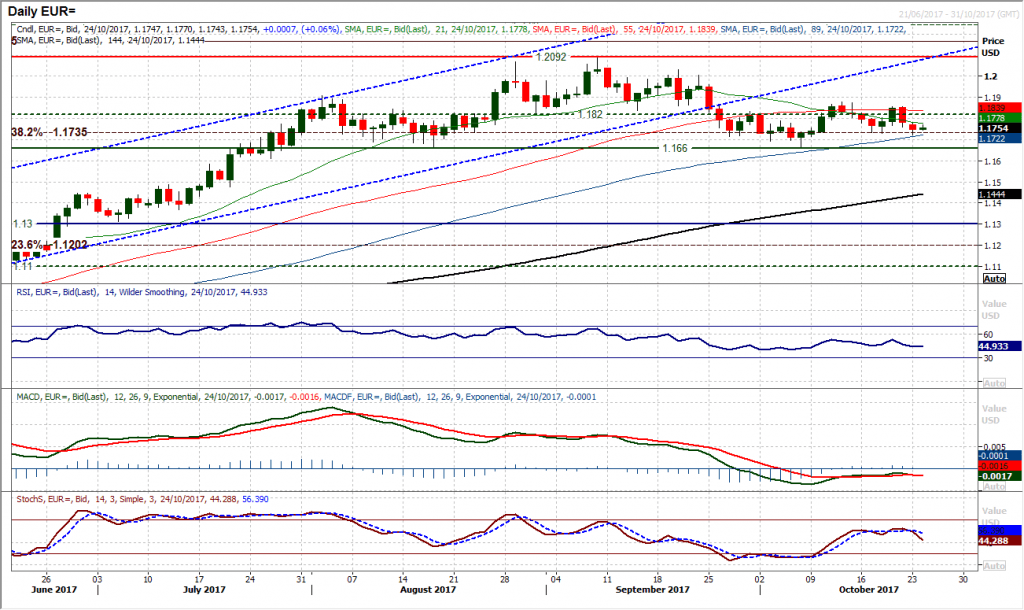
EUR/USD
There is a mild negative bias to the trading outlook which is acting as a drag in the near term. Another negative candle yesterday bounced from around the initial support of last week’s low at $1.1730 but the momentum indicators are slipping back and suggest that this is a market that is using rallies to sell into. Trading under the near term pivot at $1.1820 will maintain this outlook and the configuration of the momentum indicators suggests that the market is positioning for a test of the $1.1660 key support in due course. As the week drags on the ECB policy meeting will come ever more into focus and this could develop a consolidation, but for now strength is seen as a chance to lighten positions.
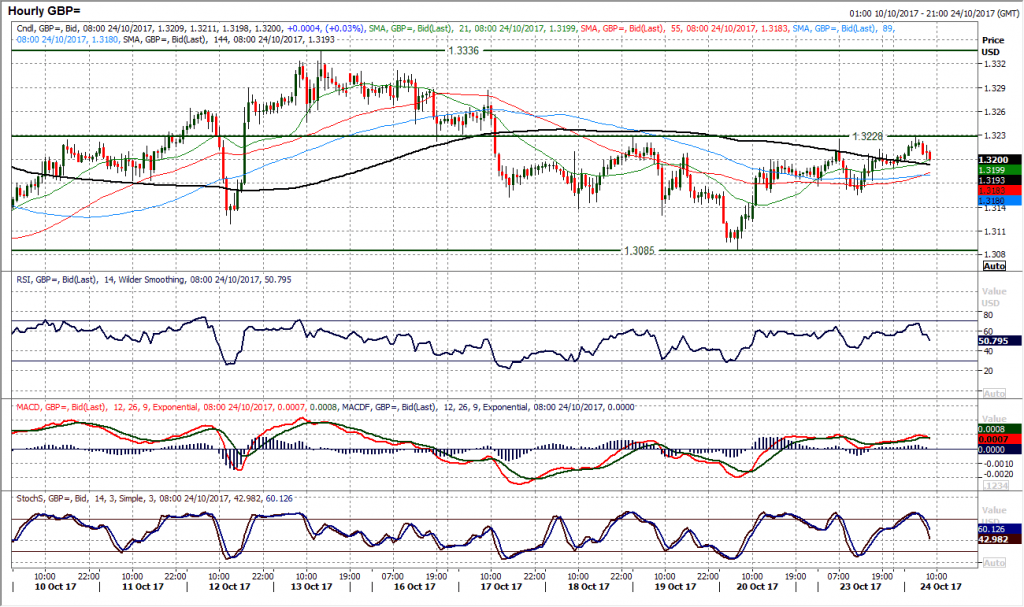
GBP/USD
Cable is a market which is extremely nuanced at the moment, with several factors able to pull it around on a daily basis. Right now there is a mild rally taking hold which is on the brink of breaking a four week downtrend. Momentum indicators are neutral but there is a slight tick higher on the Stochastics which reflect the improvement in the chart since Friday’s bull hammer candlestick. A small positive candle yesterday is being followed by early gains today and on the hourly chart this means that resistance at $1.3230 is being directly challenged. The hourly chart also shows a subtle shift in near term momentum now with an improving configuration forming on hourly RSI and MACD lines. Holding above the support at $1.3155 is now important for the recovery whilst a decisive move above $1.3230 today would complete a small head and shoulders base pattern and imply 140 pips of upside towards $1.3370, so at least suggesting a rally to test the key near term rally high at $1.3335.
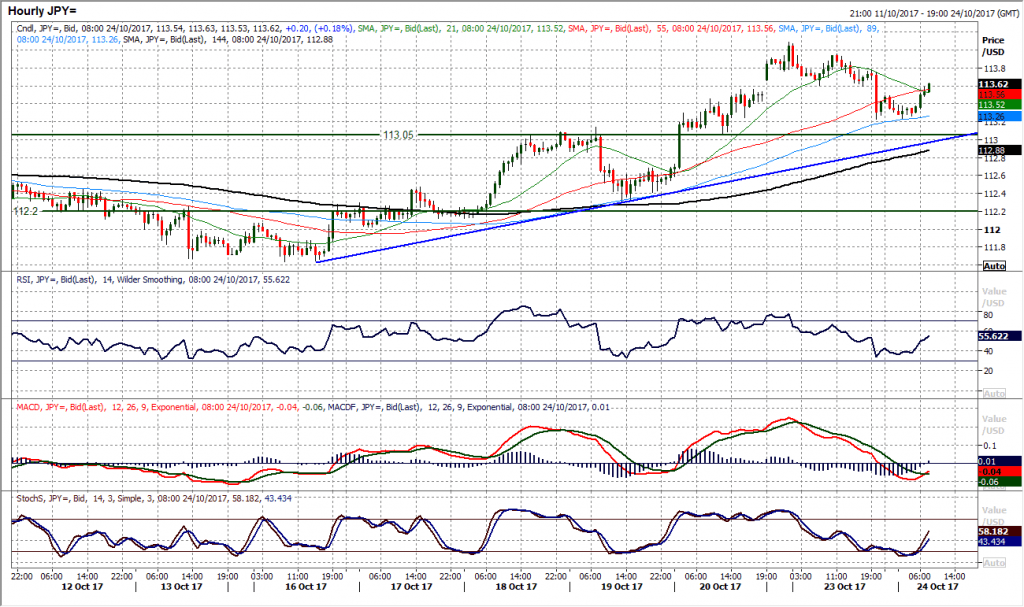
USD/JPY
The bulls will have come away from yesterday’s session disappointed, however all is not yet lost. The breakout above 113.43 was decisive but the intraday correction pulled back over 70 pips form the high of 114.10 to leave a negative candlestick for the day. However, the close was bang on the old resistance and if the bulls can settle, this is likely to still be seen as a chance to buy. The positive configuration on daily momentum indicators in addition to the sequence of higher lows suggests that corrections are being supported now. The hourly chart shows that the market has simply unwound momentum indicators back to levels where the bulls have been regaining control. The hourly RSI bouncing around the mid-30s, the Stochastics ticking higher and the MACD lines just under neutral. Furthermore, for the past two weeks the 89 hour moving average has turned from being a basis of resistance to one of support (this morning around 113.25). There is a band of support 113.05/113.43 to use as a “buy zone”. A supportive candle today would see the bulls regain the confidence for another go at the key July high at 114.50. Key near term support is now 112.30.
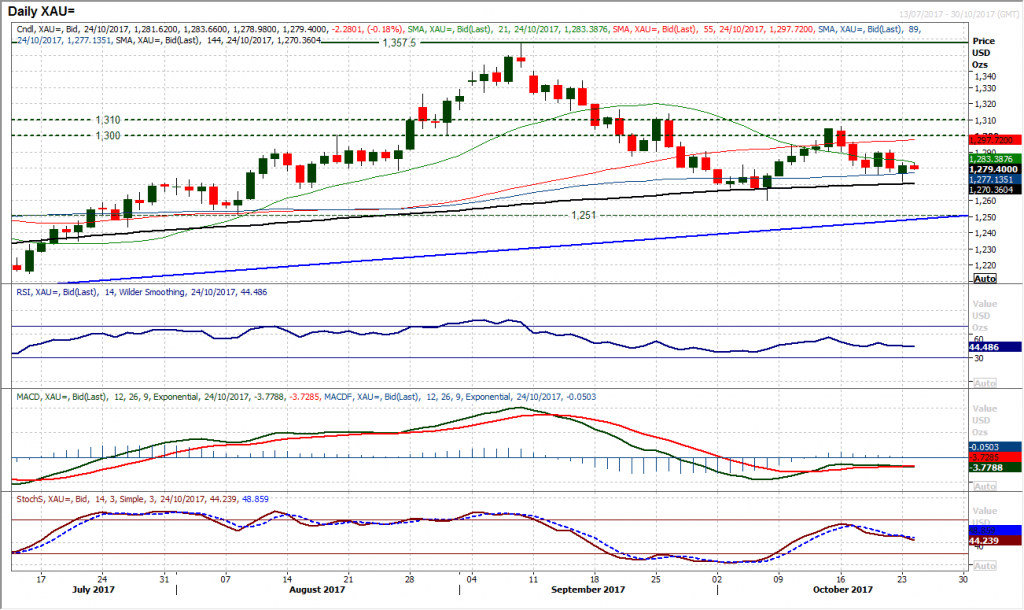
Gold
It will be interesting to see how the bulls react to yesterday’s supportive candle. A similar position was seen last week when a one day rebound failed to ignite sustained buying pressure. The negative configuration suggests that the bulls are once more unlikely to find too much traction in a recovery. The lower high at $1291 will now be the key near term gauge but there is lots of resistance overhead that is likely to prevent even an upside break from taking hold. The market has been in a correction phase since the early October rally failed. The hourly chart suggests that this rebound yesterday has helped to unwind momentum back to levels that the sellers have tended to resume control in recent days. This comes with the RSI and MACD lines already falling over and an old near term band of resistance between $1279/$1284 is a barrier to gains. Expect the market to roll over and retest the recent low at $1272, before further downside to test $1260 is likely in due course.
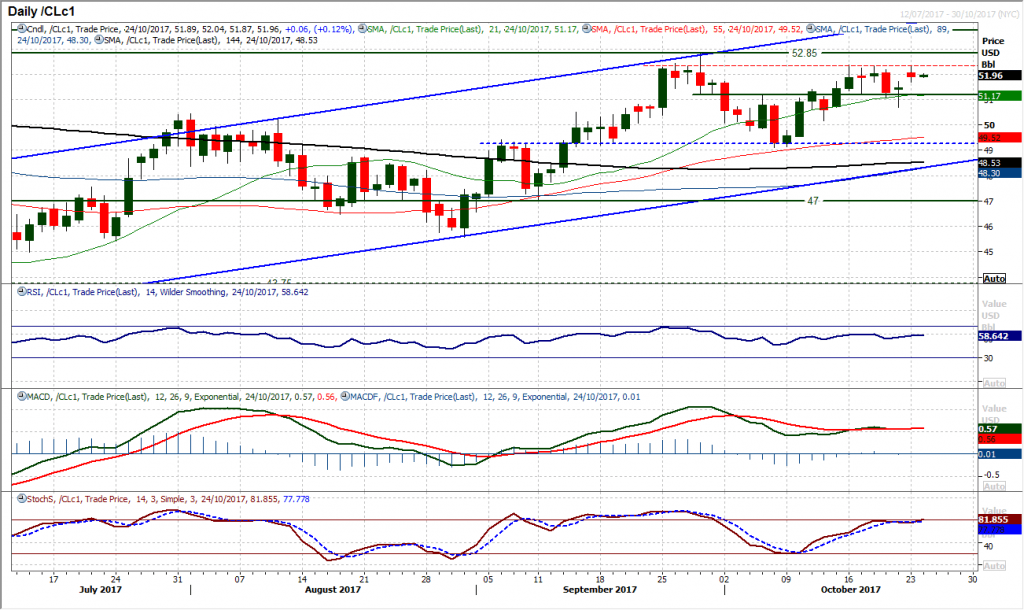
WTI Oil
Can the bulls drive a breakout today? The market rallied again yesterday only to flounder around $52.35 once more. Despite this there is a bullish bias to the market moves with the RSI pushing towards 60, and the bullish filling of the opening gap higher leaves the bulls well positioned for upside pressure. The next move is to now make a confirmed breakout above initially $52.35 but then the key September high at $52.85. In the past month, the market has repeatedly struggled to sustain a move above $52.00 and this will be a concern for the bulls as the Stochastics again begin to tail off whilst the MACD lines also flatten. However , the hourly chart shows a pivot formed over the past week at $51.70 is now supportive and the hourly momentum is also positive. Whilst holding above $51.70 the bulls will remain in the driving seat.
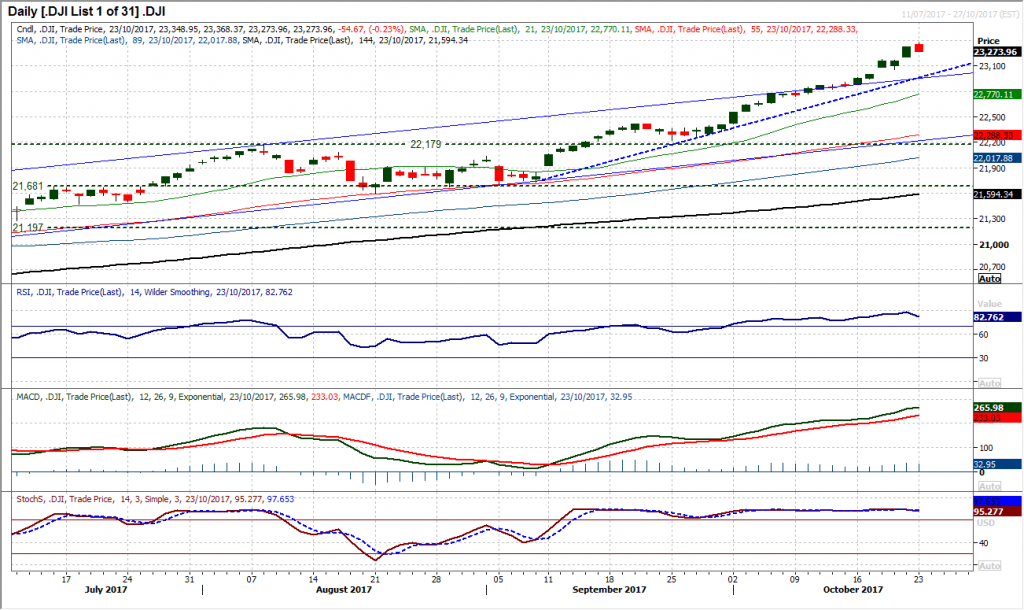
Dow Jones Industrial Average
Once more the market opens with positive intent to push another new all-time high but a subsequent intraday sell-off into the close has formed the most corrective one day candle since early September. The drop was only 55 ticks and in the context of this huge bull move, this is a tiny slip, but the big question is how the bulls react to this. There has been minimal damage done to the momentum and a supportive candle today would likely quickly forget the dip very quickly and see it as an opportunity. There is near term support at 23,053/23,173 which will be seen as a basis now, whilst a six week uptrend is supportive at 23,000 today. For now this will be seen as a chance to buy, but another negative candle today could begin to pose a few questions. Yesterday’s high at 23,368 is the new all-time high and is resistance.
Author

Richard Perry
Independent Analyst


