Liquidity is still abundant, and pre-election year seasonals are supportive – Buy the dip?

Late summer dips, particularly in election years, have been historically shallow. According to our friends at the Stock Trader's Almanac, full-month July gains in excess of 3% (this July picked up 3.3%) have historically been followed by declines of just under 7% on average or a median of just under 5% (stats are based on the Dow Jones Industrial Average). The current correction based on E-mini S&P 500 futures has been roughly 5% and about 3% in the Dow. In the big picture, these corrections fall into the drop-in-the-bucket category, but that's par for the course during this time of year. Further, the Fed has pulled out all the stops and still hasn't been able to slow down the freight train loaded with liquidity injected into the economy in 2020. While they have sucked some of the froth out of the system, the M2 money supply is still well above levels seen before 2020, and we think this keeps the train on track for now. Thus, we suspect the path of least resistance for the major indices will be higher in the coming weeks. Here are some of our thoughts on this.
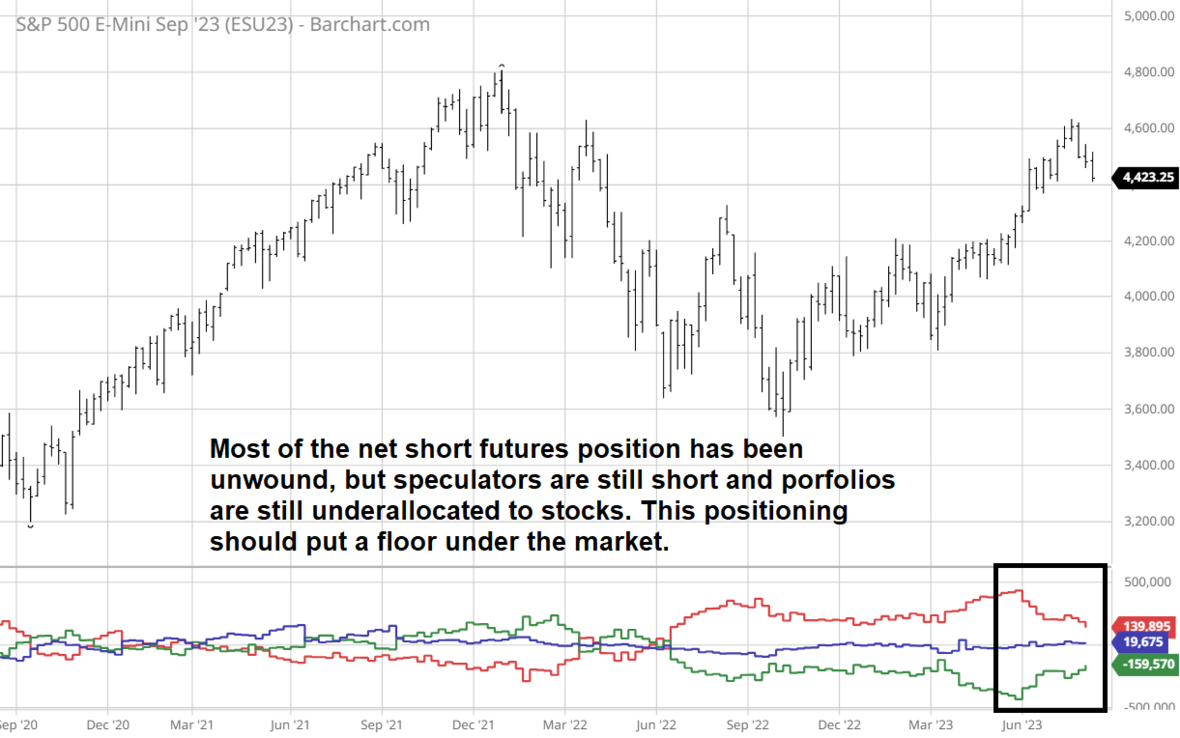
COT report
We have pointed out the massive bearish short position in the futures markets for months. According to the Commitments of Traders Report (COT) issued by the CFTC (Commodity Futures Trading Commission), the historically significant net short position has been largely unwound, but speculators are still short the market; the longer equities hold up, the more likely short speculators are to cover their positions (creating motivated buyers).
There are also reports of under allocation to equities in many portfolios and the accumulation of sidelined cash. Given the overwhelmingly bearish narrative on business news, we would guess investors are hoping for a larger dip to employ the capital. However, when the majority are looking for something to happen, the markets deliver the opposite.
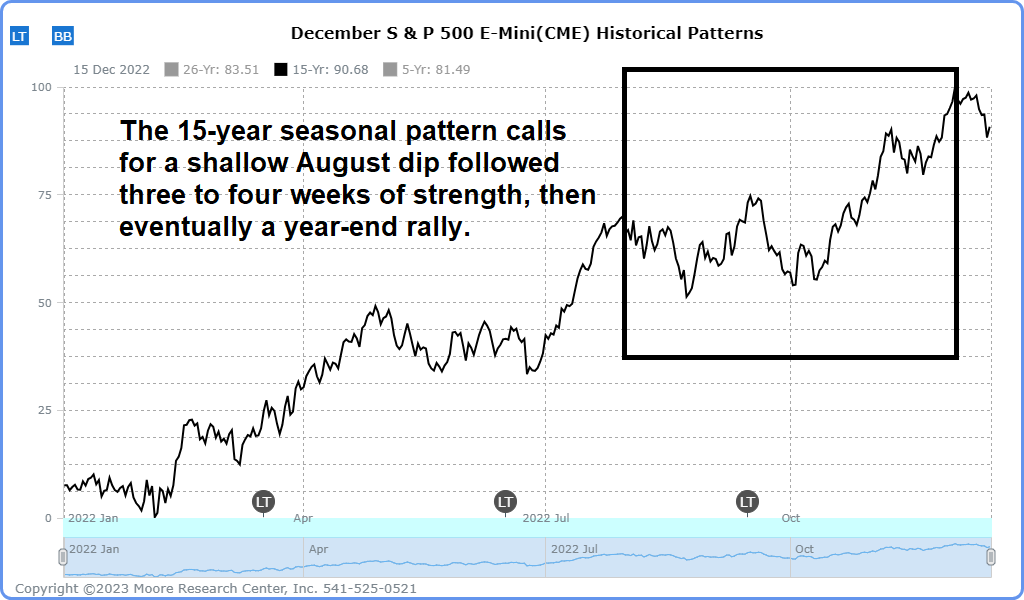
Seasonality
Summer swoons have historically been relatively shallow. According to the 15-year stats compiled by MRCI, dips are most likely to find support in the third week of August before rallying through most of September. In the larger picture, we generally see a strong end to the year; this is particularly true of pre-election years.
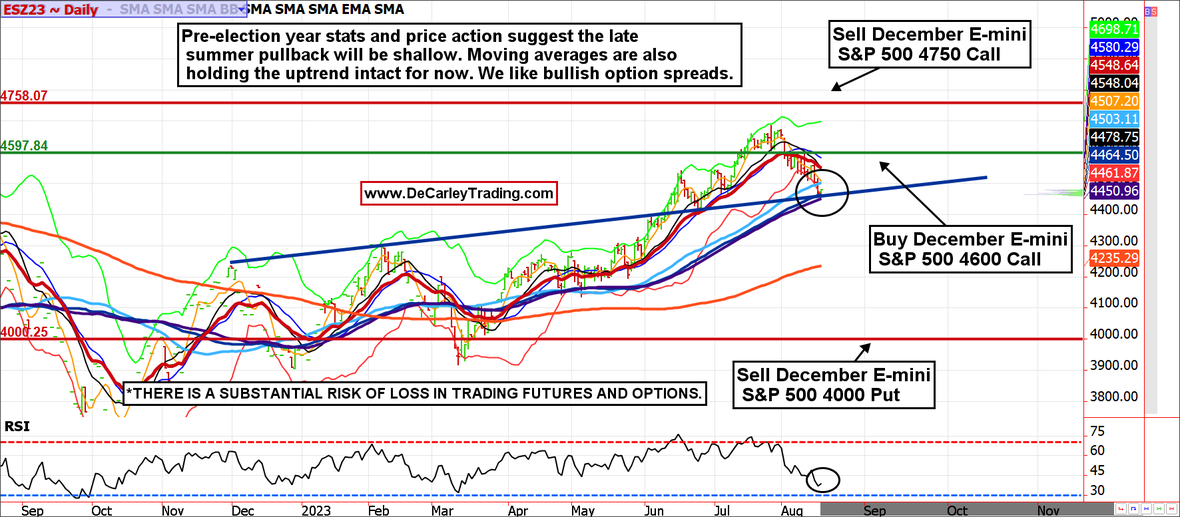
Daily chart
The E-mini S&P 500 broke out of its daily trading range in mid-June and retested that same trading range in late June. As is often the case, the previous area of resistance became support; that particular support sparked a rally that carried the index to the mid-4600s. The current index decline is forcing a second retest of the breakout trendline. Coincidentally, the 70-day simple moving average lies on the trendline (we find this to be more helpful in holding trends than the more talked about 50-day moving average). If seasonality and our thesis of excessive liquidity in the system holds true, it should offer enough support to fend off the bears, at least for now. Standard back-and-fill trading would likely test the 20-day moving average near 4500, but a close above that should pave the way for a little over 4700.
Author

Carley Garner
DeCarley Trading
Carley Garner is an experienced commodity broker with DeCarley Trading, a division of Zaner, in Las Vegas, Nevada. She is also the author of multiple books including, “Higher Probability Commodity Trading” and “A Trader's First Book on Commodities”.


