Dogecoin Elliott Wave technical analysis [Video]
![Dogecoin Elliott Wave technical analysis [Video]](https://editorial.fxstreet.com/images/Markets/Currencies/Cryptocurrencies/Dogecoin/dogecoin-200x200-637483778649728159.jpg)
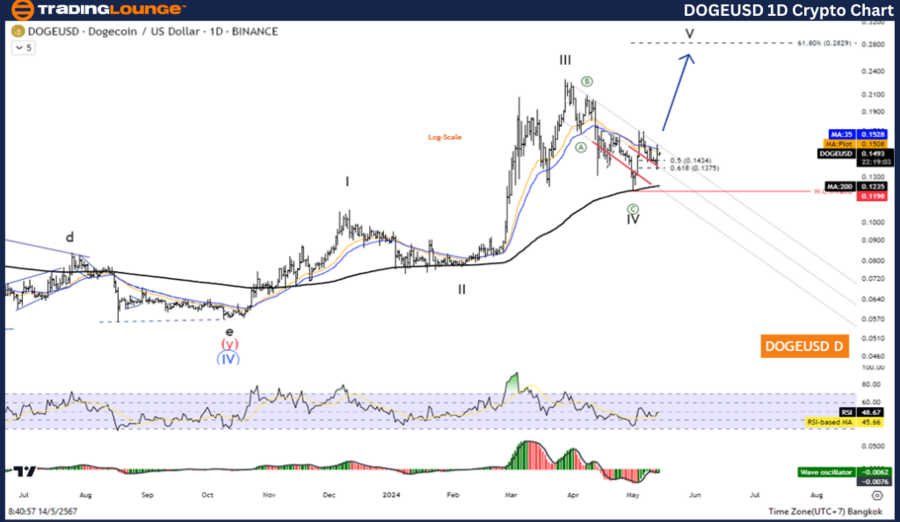
Elliott Wave Analysis TradingLounge Daily Chart,
Dogecoin/ U.S. dollar (DOGEUSD)
DOGE/USD Elliott Wave technical analysis
Function: Counter Trend.
Mode: Corrective.
Structure: Zigzag.
Position: Wave ((C)).
Direction next higher degrees: Wave IV of Impulse.
Details: Wave IV May is complete and the price increase again in Wave V.
Dogecoin/ U.S. dollar(DOGEUSD)Trading Strategy: Overall, Dogecoin remains in an uptrend. Moreover, it looks like the correction is over. And prices are rising again in the fifth wave. But there may be a slight pullback before increasing. So look for opportunities to join the uptrend.
Dogecoin/ U.S. dollar(DOGEUSD)Technical Indicators: The price is above the MA200 indicating an Uptrend, The Wave Oscillator is a Bullish Momentum.
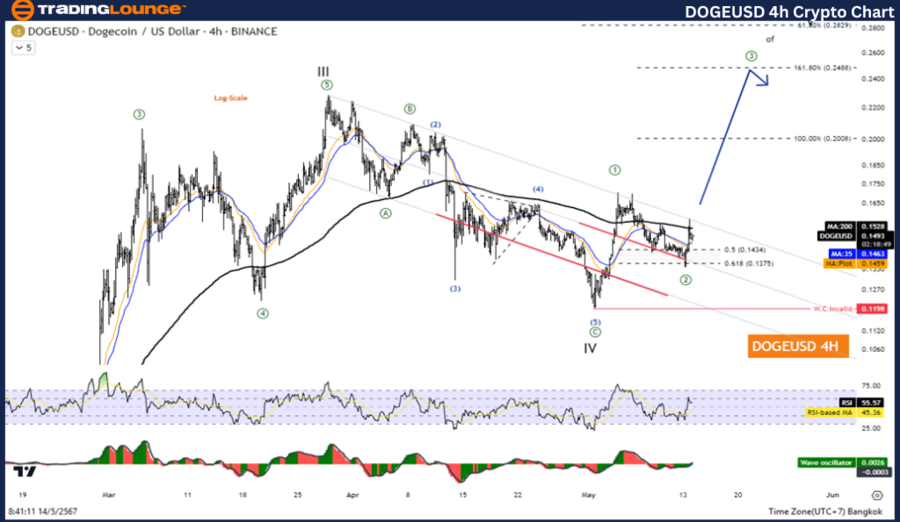
DOGE/USD Elliott Wave four-hour chart
Function: Counter Trend.
Mode: Corrective.
Structure: Zigzag.
Position: Wave ((C)).
Direction next higher degrees: Wave IV of Impulse.
Details: Wave IV May is complete and the price increase again in Wave V.
Dogecoin/ U.S. dollar(DOGEUSD)Trading Strategy: Overall, Dogecoin remains in an uptrend. Moreover, it looks like the correction is over. And prices are rising again in the fifth wave. But there may be a slight pullback before increasing. So look for opportunities to join the uptrend.
Dogecoin/ U.S. dollar(DOGEUSD)Technical Indicators: The price is above the MA200 indicating an Uptrend, The Wave Oscillator is a Bullish Momentum.
Dogecoin Elliott Wave technical analysis [Video]
Author

Peter Mathers
TradingLounge
Peter Mathers started actively trading in 1982. He began his career at Hoei and Shoin, a Japanese futures trading company.


