Labour Losing Ground In Last Two Weeks
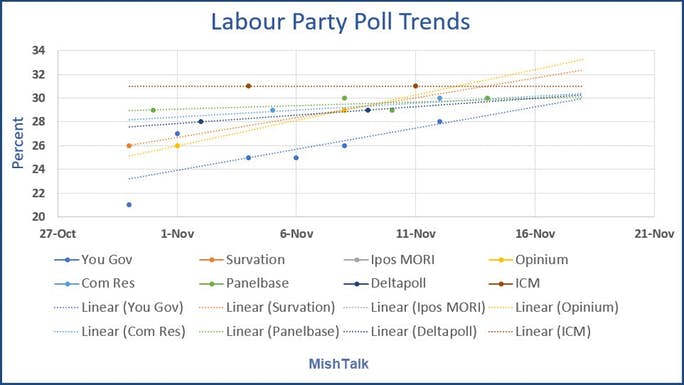
Polls have mostly stabilized since the end of October. On average, Labour has lost a percentage point.
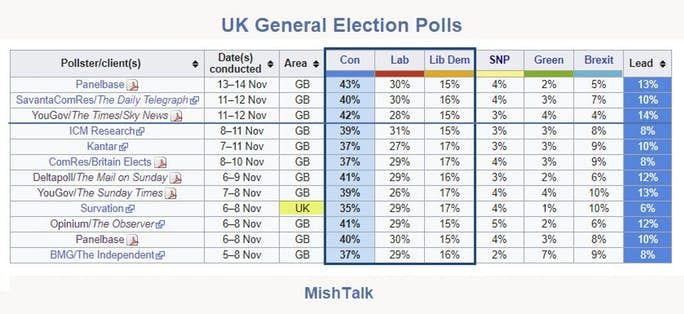
The above chart from Opinion polling for the 2019 United Kingdom general election.
The blue horizontal line represents the November 11 Brexit Party announcement that it would not compete in districts won by the Tory Party in 2017.
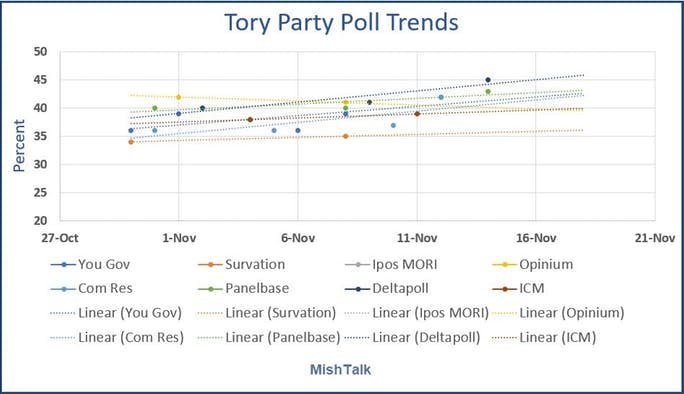
Since the end of October, the Tories, on average have gained about 1 percentage point over Labour.
A set of charts and tables I created shows these trends better.
Tory Party Poll Trends
Labour Party Poll Trends
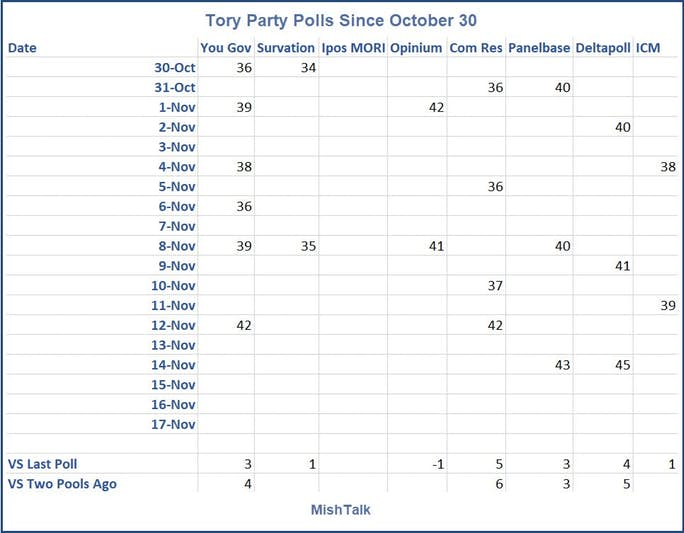
Tory Party Polls Since October 30
Labour Party Polls Since October 30
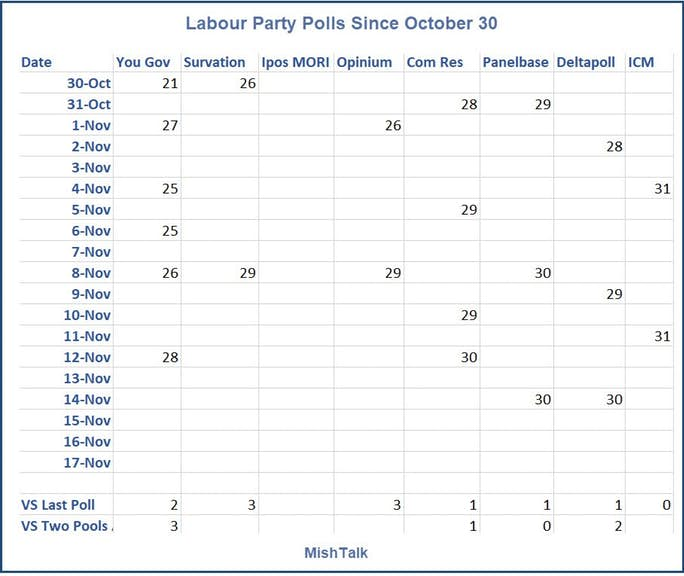
Gains
- The polls show a pickup by the Tories primarily at the expense of the Brexit Party
- The polls show a pickup of Labour primarily at the expense of the Liberal Democrats
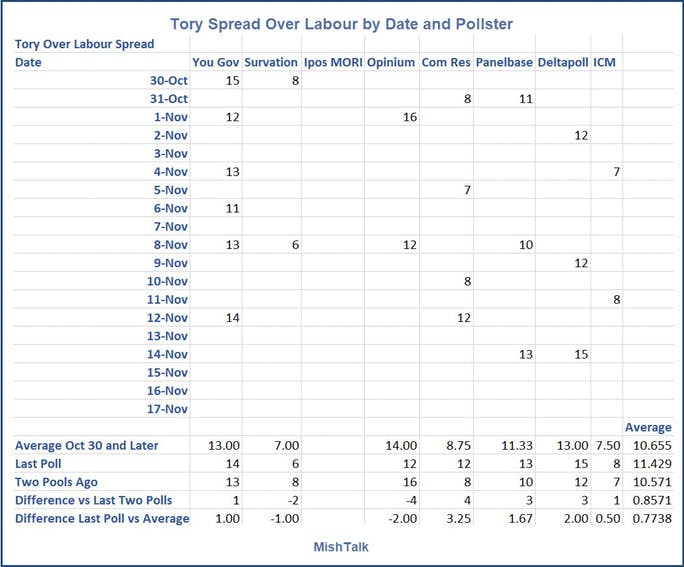
What matters most is the trend of the Tories vs the trend of Labour. That's what my next chart shows.
Tory Spread Over Labour by Date and Pollster
Notes
- Ipos Mori has not had any polls in the desired period.
- Oct 30 is a bit stale but otherwise Survation would only have a single data point.
- Wikipedia does not have the latest Deltapoll so it is not shown in the lead chart. I do not know the survey date other than "since November 9". I used November 14.
Why are the Polls Telling Such Different Stories?
Mat Singh asks Why are the Polls Telling Such Different Stories?
Since there are many ways in which methodologies can differ, and many of them interact with one another, it can be difficult to unpick exactly why two or more pollsters consistently arrive at different estimates of public opinion. But sometimes the source of the variation can be inferred.
In 2017, for example, final polls varied wildly on the size of the Conservative lead. In this case, the primary reason was clear. Those showing narrow Tory leads over Labour were basing their turnout assumptions on how likely people said they were to vote. Those showing wider leads were using complex turnout modelling instead. Some of these models went very over-the-top, leaving too few Labour voters among those expected to vote.
In 2019, there again seems to be a clear explanation for at least part of the discrepancy. Among the possible weighing variables mentioned above, many UK pollsters weight their samples to ensure that the way their respondents voted in the last election matches the result. In theory, this makes complete sense – a representative sample should match the result.
In practice, it’s not so simple. Though it may sound strange to political anoraks, a lot of people are very, very bad at remembering which way they voted, even in the recent past. A number of pollsters have conducted experiments where they interviewed people who had said just after the 2017 election that they had voted Labour, and asked them once again how they had voted in 2017. In one case, about one in five, or about 8 per cent of all 2017 voters, thought that they had voted for a party other than Labour.
So it follows if we have the right proportion of actual 2017 Labour voters (41% of the Great Britain vote) we would have a much lower proportion of those remembering having voted Labour last time. If we were to weight people’s recalled 2017 vote to the result, we would then end up with too many 2017 Labour voters.
There are a few ways to deal with this. Some online pollsters, including YouGov and Opinium, past vote weight using 2017 votes collected at the time, thus taking memory out of the equation. Others, such as Kantar and Deltapoll, weight using recalled past vote, but to a target adjusted for false recall. And still others, namely Number Cruncher and Ipsos MORI, don’t rely on past vote weighting at all.
The average Conservative lead among this set of pollsters in polls so far during the campaign has been 13 points. Among the rest, it’s been 8 points. Does this mean that the set showing the wider leads are right and the others are wrong? I would exercise a degree of caution here.
The methodologies that lead to bigger Tory leads have ways of dealing with or avoiding a known difficulty for pollsters while the others do not. But in any election, particularly one as complicated as this, there are a number of other potential sources of error that could affect polling accuracy in either direction. And as always, polls are a measurement of the present, not a prediction of the future.
So while the true gap between current Labour and Conservative vote shares may be a bit likelier to sit near the wider end of range of polls, the fog of uncertainty remains.
Reflections on Current Trends
- The smallest current leads are by Survation +6 (down 2 since prior poll) and ICM at +8 (up 1 since prior poll). Survation only has a couple recent polls to look at and the first isn't all that recent (Oct 30).
- If you are a Labour backer, not only do you need the Survation and ICM polls to be more correct, you also need gains in the polls in general. However, the most recent ICM poll went the other way.
- Recent poll-to-poll comparisons with the same pollster over time, shows a net 1 percentage point gain of the Tories vs Labour.
- For Labour, this represents two weeks of going nowhere, at best, unless Survation alone is on track.
- While it is possible that Survation alone has things correct, it seems unlikely. And even still, a six point pargin rates to be enough (albeit barely), for a Tory majority.
- At this point, every poll needs to be wrong for Labour to win.
Sticking With My 351 Tory Seat Projection
Given that the polls have essentially gone nowhere for two weeks, I am sticking with my 351 Tory seat projection as noted in UK Election Math: What are the Odds of a Hung Parliament?
Election in 3 Weeks plus 5 days!
Author

Mike “Mish” Shedlock's
Sitka Pacific Capital Management,Llc


