Is it time for NZD/USD to reverse south?

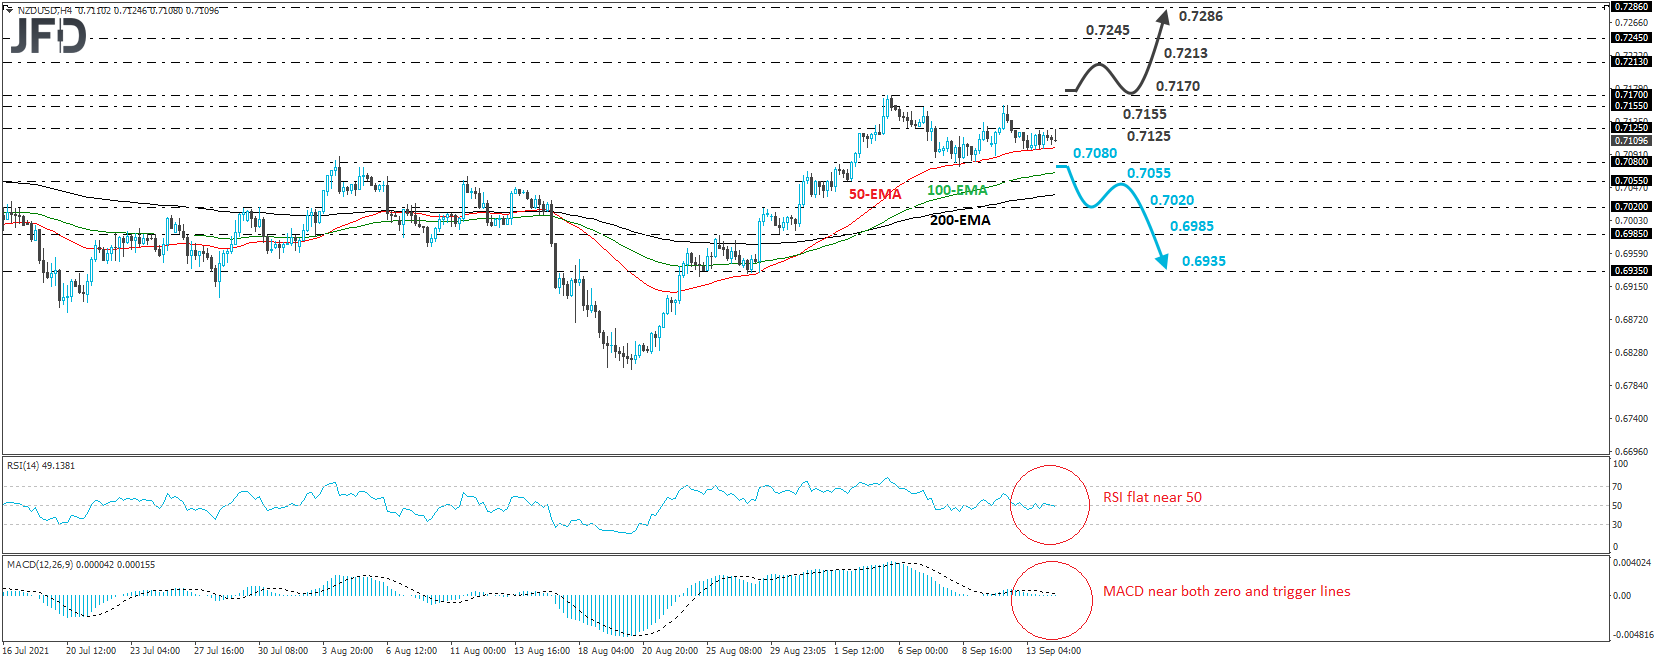
NZD/USD has been trading in a consolidative manner so far this week, slightly below the 0.7125 barrier. In the bigger picture, the pair recently stopped forming higher highs and higher lows, and began printing lower highs, as shown by the peaks of September 3rd and 10th. That said, it has yet to go for a lower low. Thus, until we see such a technical signal, we prefer to remain sidelined.
A clear and decisive dip below 0.7080 would confirm such a lower low and may signal a short-term bearish reversal, as it may mark the completion of a failure swing top formation on the 4-hour chart. The first stop after that may be the low of September 2nd, at 0.7055, the break of which could pave the way towards the inside swing high of August 27th, or the low of August 30th, at around 0.7020 and 0.6985 respectively. If neither barrier is able to halt the slide, then we could see extensions towards the low of August 27th, at 0.6935.
Shifting attention to our short-term oscillators, we see that the RSI lies flat near its 50 line, while the MACD is also pointing east, and lies near both its zero and trigger lines. Both indicators suggest absent of directional momentum and confirm our choice to stay flat for now.
On the upside, we would like to see a break above 0.7170, the high of September 3rd, before we start examining whether the bulls are back in control. We could initially see advances towards the 0.7213 level, marked by the high of June 11th, or the 0.7245 barrier, defined as a resistance by the high of June 7th. If the advance does not stop there, then the next territory to consider as a potential stop may be the 0.7286 area, marked by the high of June 1st.
Author

JFD Team
JFD


