![]()
US traders are eagerly counting down the hours until the much-awaited Thanksgiving holiday, but our readers should is still a busy economic calendar between now and Wednesday afternoon, as well as a couple of noteworthy economic releases on Thursday and Friday.
Key economic data remaining this week (all times GMT):
- Today: BOJ monetary policy meeting minutes (11:50 GMT)
- Wednesday: AU construction work done (0:30), Speech by RBA Assistant Governor Debelle (10:20), UK Autumn forecast statement (12:30), US durable goods, unemployment claims, core PCE, personal income and personal spending (13:30), US new home sales (15:00), NZ trade balance (21:45)
- Thursday: AU private capital expenditures (0:30), JP household spending and Tokyo CPI (23:30)
- Friday: UK Q3 GDP second estimate (9:30)
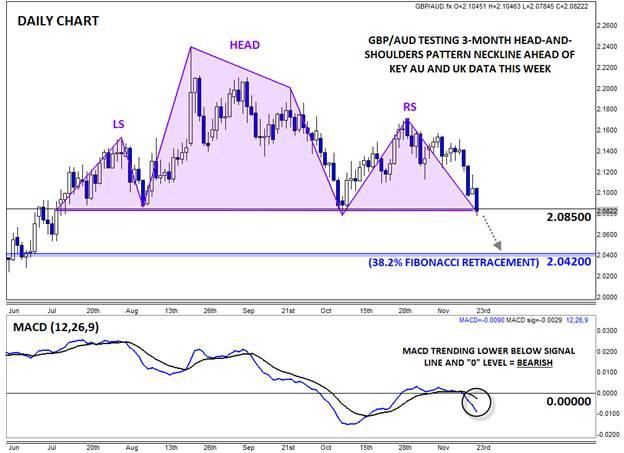
On a technical basis, GBP/AUD has carved out a potential head-and-shoulders pattern over the last four months. For the uninitiated, this classic price action pattern shows a shift from an uptrend (higher highs and higher lows) to a downtrend (lower lows and lower highs) and is typically seen at major tops in the chart.
The head-and-shoulders pattern would only be confirmed by a break below the neckline, which in this case comes at 2.0850, conveniently close to the current market price. Therefore, the price action over the rest of the week may set the tone for what to expect from GBP/AUD over the rest of the year.
If we see a confirmed break below 2.0850 support (which the downward trending MACD suggests), GBP/AUD could well fall to the 38.2% Fibonacci retracement of the entire September 2014-August 2015 rally at 2.0420 next. In fact, the measured move objective of the head-and-shoulders pattern would be well below the 2.00 handle. That said, if buyers are able to step in to defend the 2.0850 level, a bounce toward the 2.12-14 zone would be more likely.
This research is for informational purposes and should not be construed as personal advice. Trading any financial market involves risk. Trading on leverage involves risk of losses greater than deposits.
Recommended Content
Editors’ Picks
AUD/USD remains firm above 0.6600 ahead of RBA

AUD/USD maintains its bullish bias well and sound on Monday, extending the multi-session recovery past the 0.6600 barrier ahead of the key interest rate decision by the RBA.
EUR/USD keeps the constructive tone near 1.0800

EUR/USD started the week in a positive note amidst the Dollar’s inconclusive price action, altogether motivating the pair to attempt a move to the proximity of the 1.0800 region, where the 200-day SMA also converges.
Gold holds on to modest gains around $2,320

Gold trades decisively higher on the day above $2,320 in the American session. Retreating US Treasury bond yields after weaker-than-expected US employment data and escalating geopolitical tensions help XAU/USD stretch higher.
Bitcoin price holds above $63K as MicroStrategy tops BTC ownership list

Bitcoin (BTC) price recorded a rather bold two days this past weekend in a surge that saw millions in positions liquidated. However, the week is off to a calm start with altcoins sucking liquidity from the BTC market.
Stagflation warning: Service economy contracts as prices rise

In another stagflation warning sign, the U.S. service sector contracted in April even as service prices rose. The Institute for Supply Management's non-manufacturing PMI dropped to 49.4 in April, dipping from 51.4 in March.
