![]()
As we noted yesterday, the New Zealand dollar (and associated economic data) was serving as a “warm up” act for the “main event” US and UK data to come. Based on what we’ve seen though, it was a rather disappointing warm up, at least for kiwi bulls.
Following yesterday’s disappointing GDT auction data, traders learned that the New Zealand economy actually saw a 0.4% decline in employment in Q3, badly missing the expectations for a 0.4% rise. Meanwhile, the unemployment rate in the island nation rose to 6.0%, as anticipated. This disappointing report raises the risk that the Reserve Bank of New Zealand will have to cut interest rates by year-end, and the kiwi has suffered as a result.
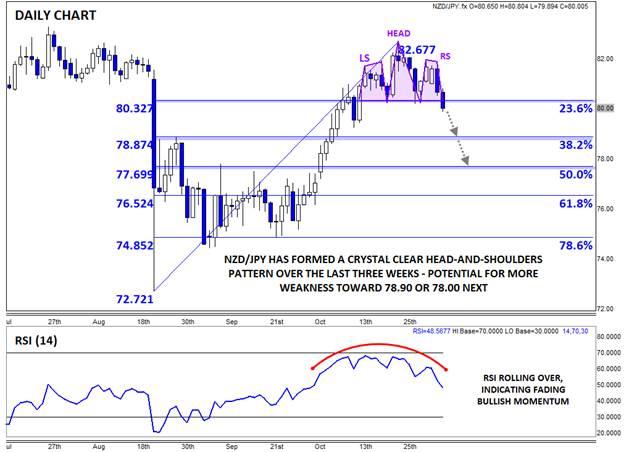
Potentially the most interesting pair to watch is NZD/JPY, which has formed a crystal clear head-and-shoulders pattern over the last three weeks. For the uninitiated, this classic price action pattern shows a shift from an uptrend (higher highs and higher lows) to a downtrend (lower lows and lower highs) and is typically seen at major tops in the chart.
Just yesterday, the pair broke below its neckline (which coincided with the 23.6% Fibonacci retracement at 80.30), confirming the pattern and opening the door for a big leg lower. The recent rounded top in the RSI indicator also supports the view that the bullish momentum has rolled over.
Based on the measured move objective (the height of the pattern, 230 pips, projected down from the neckline), NZD/JPY could all the way to 78.00, but more conservative traders may want to look toward the 38.2% Fibonacci retracement at 78.90 as a more attainable target. At this point, only a strong rally back above the right shoulder at 82.00 would turn the bias back in favor of the buyers.
This research is for informational purposes and should not be construed as personal advice. Trading any financial market involves risk. Trading on leverage involves risk of losses greater than deposits.
Recommended Content
Editors’ Picks
AUD/USD retargets the 0.6600 barrier and above

AUD/USD extended its positive streak for the sixth session in a row at the beginning of the week, managing to retest the transitory 100-day SMA near 0.6580 on the back of the solid performance of the commodity complex.
EUR/USD keeps the bullish bias above 1.0700

EUR/USD rapidly set aside Friday’s decline and regained strong upside traction in response to the marked retracement in the Greenback following the still-unconfirmed FX intervention by the Japanese MoF.
Gold advances for a third consecutive day

Gold fluctuates in a relatively tight channel above $2,330 on Monday. The benchmark 10-year US Treasury bond yield corrects lower and helps XAU/USD limit its losses ahead of this week's key Fed policy meeting.
Bitcoin price dips to $62K range despite growing international BTC validation via spot ETFs

Bitcoin (BTC) price closed down for four weeks in a row, based on the weekly chart, and could be on track for another red candle this week. The last time it did this was in the middle of the bear market when it fell by 42% within a span of nine weeks.
Japan intervention: Will it work?

Dear Japan Intervenes in the Yen for the first time since November 2022 Will it work? Have we seen a top in USDJPY? Let's go through the charts.
