![]()
The S&P 500 is testing key 200-day support on Wednesday after slipping to the bottom of its range on the back of a global bout of risk aversion triggered by further declines in the Chinese stock market. However, we have started to notice a few ominous signs closer to home that could make the rest of Q3 and Q4 more difficult terrain for stock investors to navigate.
We think that investors should be watching two charts right now, which could spell a more serious period of unrest for US stocks.
1, US high yield corporate debt
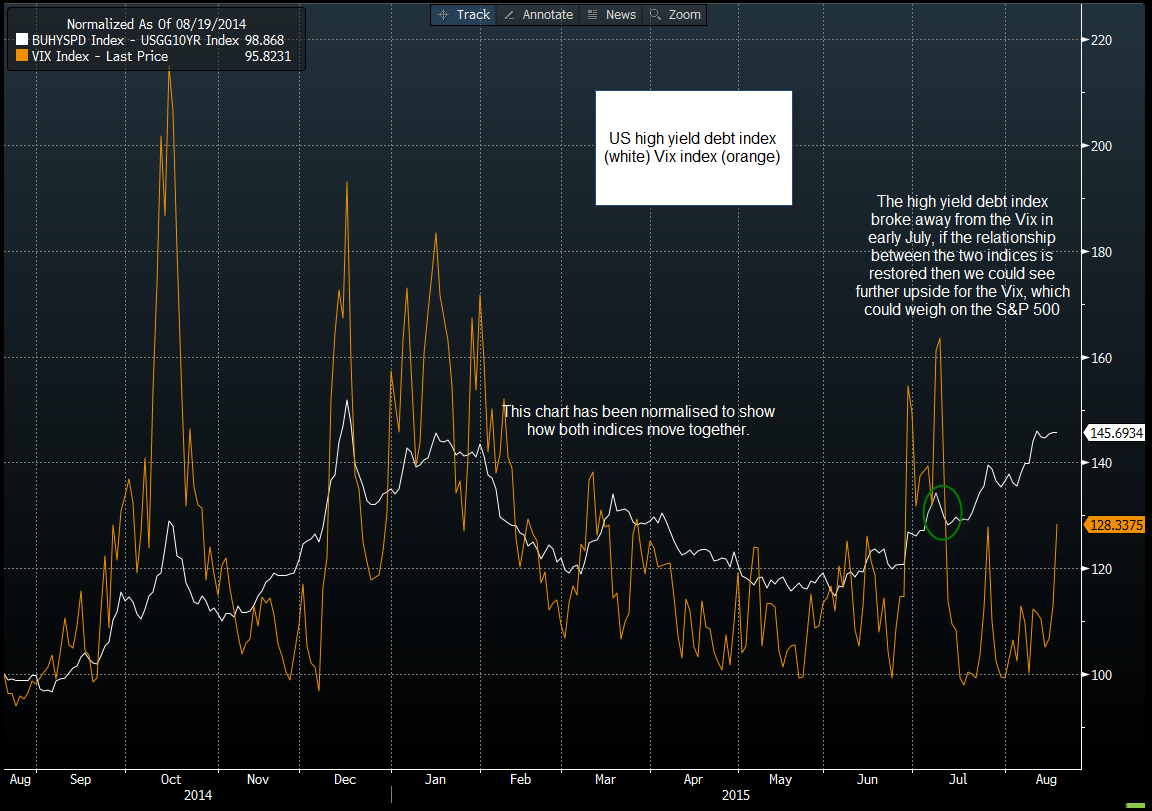
High yield corporate debt is considered a bell weather for investor risk sentiment, so when it starts to show signs of stress, stock investors should take note. The chart below shows the Bloomberg high yield US corporate debt index and the Vix index, a measure of volatility in the S&P 500. This chart has been normalised, and as you can see, these two indices have generally traded in the same direction over the last year.
However, the high yield debt index has accelerated in recent weeks, as investors have charged more to hold the riskiest end of the US corporate debt market, it overtook the Vix in mid-July. The debt index is now at its highest level since December 2014, if this relationship is to hold then we could see further upside for the Vix. This is important for the S&P 500, since the Vix tends to have an inverse correlation with the S&P 500, thus if the Vix rises we may see the S&P 500 come under further downward pressure.
Figure 1:
Source: Gain Capital, Data: Bloomberg
2, Apple
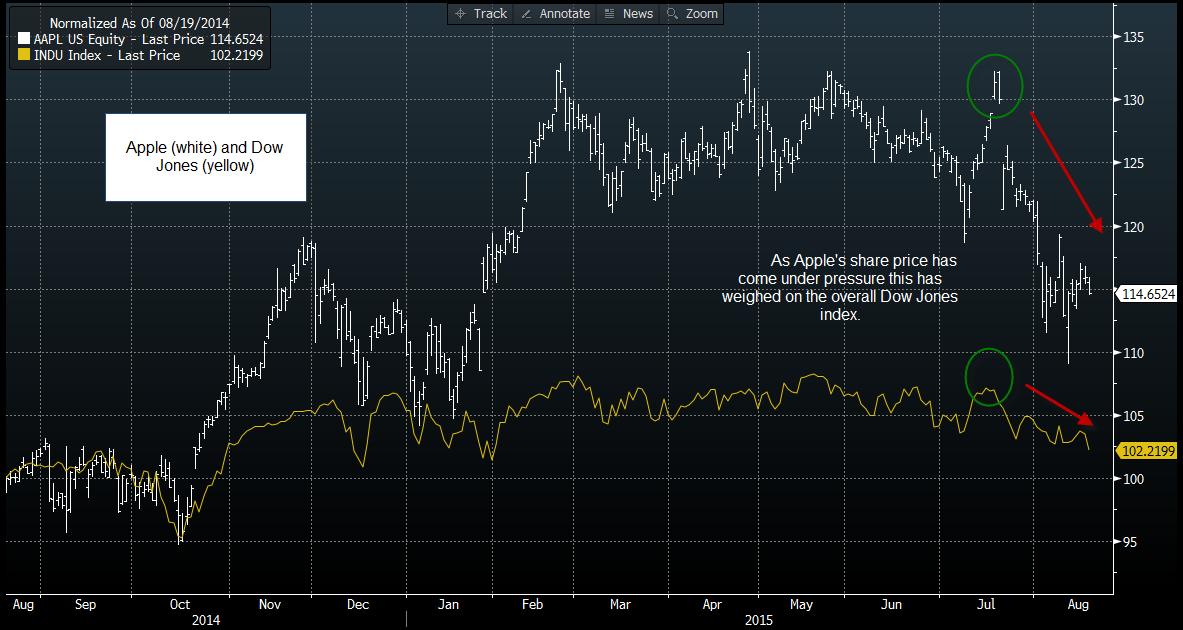
The tech giant, and the world’s most valuable company, has seen its share price struggle in recent months after peaking on 28th April, one month since its inception into the Dow Jones. The stock price is now below its 200-day sma and is nearly 15% below its April peak. This matters a lot to the Dow Jones Industrial Average, since this index is weighted according to market capitalisation. This means that when highly valued companies like Apple fall sharply it can have a big downward impact on the index.
Figure 2 shows Apple’s share price alongside the Dow Jones. This chart has been normalised to show how the two move together. There are two things to note about this chart: firstly, the Dow has underperformed Apple since Q4 2014, secondly, since Apple’s sharp slide in July, this has corresponded with a weakening in the overall Dow Index.
To conclude, if Apple’s share price falls into bear market territory (a drop of 20% or more), then we could see further weakness for the Dow, which is already below a cluster of moving average support and is close to its lowest level since February, leaving it technically vulnerable to further losses.
Figure 2:
Source: Gain Capital, Data: Bloomberg
Information on these pages contains forward-looking statements that involve risks and uncertainties. Markets and instruments profiled on this page are for informational purposes only and should not in any way come across as a recommendation to buy or sell in these assets. You should do your own thorough research before making any investment decisions. FXStreet does not in any way guarantee that this information is free from mistakes, errors, or material misstatements. It also does not guarantee that this information is of a timely nature. Investing in Open Markets involves a great deal of risk, including the loss of all or a portion of your investment, as well as emotional distress. All risks, losses and costs associated with investing, including total loss of principal, are your responsibility. The views and opinions expressed in this article are those of the authors and do not necessarily reflect the official policy or position of FXStreet nor its advertisers. The author will not be held responsible for information that is found at the end of links posted on this page.
If not otherwise explicitly mentioned in the body of the article, at the time of writing, the author has no position in any stock mentioned in this article and no business relationship with any company mentioned. The author has not received compensation for writing this article, other than from FXStreet.
FXStreet and the author do not provide personalized recommendations. The author makes no representations as to the accuracy, completeness, or suitability of this information. FXStreet and the author will not be liable for any errors, omissions or any losses, injuries or damages arising from this information and its display or use. Errors and omissions excepted.
The author and FXStreet are not registered investment advisors and nothing in this article is intended to be investment advice.
Recommended Content
Editors’ Picks
EUR/USD holds gains above 1.0700 as USD struggles ahead of data

EUR/USD is posting small gains above 1.0700 in the European session on Thursday. The pair remains underpinned by a sustained US Dollar weakness, in the aftermath of the Fed policy announcements and ahead of more US employment data.
GBP/USD stays firm above 1.2500 amid US Dollar weakness

GBP/USD is consolidating the rebound above 1.2500 in European trading on Thursday. The pair's uptick is supported by a broadly weakness US Dollar on dovish Fed signals. A mixed market mood could cap the GBP/USD upside ahead of mid-tier US data.
Gold price trades with modest losses amid positive risk tone, downside seems limited

Gold price edges lower amid an uptick in the US bond yields, though the downside seems cushioned. A positive risk tone is seen as another factor undermining demand for the safe-haven precious metal.
Top 3 Price Prediction BTC, ETH, XRP: Altcoins to pump once BTC bottoms out, slow grind up for now

Bitcoin reclaiming above $59,200 would hint that BTC has already bottomed out, setting the tone for a run north. Ethereum holding above $2,900 keeps a bullish reversal pattern viable despite falling momentum. Ripple coils up for a move north as XRP bulls defend $0.5000.
Happy Apple day

Apple is due to report Q1 results today after the bell. Expectations are soft given that Apple’s Chinese business got a major hit in Q1 as competitors increased their market share against the giant Apple.

