![]()
Crude oil prices continue to head south. As before, they are being driven lower predominantly because of the disequilibrium created from the supply side of the equation. In fact, it is not just the actual supply but the expected growth in supply that are also weighing on prices. Although the demand outlook has improved somewhat, it is nowhere near strong enough to help offset the steep rises in supply. The latest manufacturing data from China does not bode well either.
Indeed, at just over 32 million barrels per day, the OPEC produced a lot more oil last month than was need. That’s according to the latest estimates from both Bloomberg and Reuters. Once again, it was the largest OPEC producers – Saudi and Iraq – that led the charge as they produced record amounts of the stuff due to their single focus of defending market share. Expectations about even higher levels of production from the OPEC are increasing. That’s because Iran may immediately raise its output by up to 500,000 barrels per day as soon as the US-led sanctions are lifted and then by a million bpd within a month according to Iran’s oil minister – previously it was thought that the country’s oil exports could hit the one million bpd mark within six months. Oil output from Libya continues to be hampered by the on-going conflicts between the government forces and the rebels. Thus, if the situation there were to improve then the excessive global supply situation could exacerbate.
Meanwhile in the US, the latest weekly rig count data from Baker Hughes has shown an increase of 5 to 664. Although admittedly this was a smaller rise compared to the prior week’s increase of 21, it is now the fourth time in 5 weeks that the number of rigs in use has risen. Shale producers are refusing to throw in the towel just yet and evidently production at these levels is still profitable for some. That probably explains why optimism among money managers continues to fall. The latest positioning data from the CFTC shows that net long positions fell to their lowest level since December 2012 after decreasing by another 7,700 contracts in the week to 28 July. As WTI prices have since fallen further, it is likely that the net longs were trimmed even more.
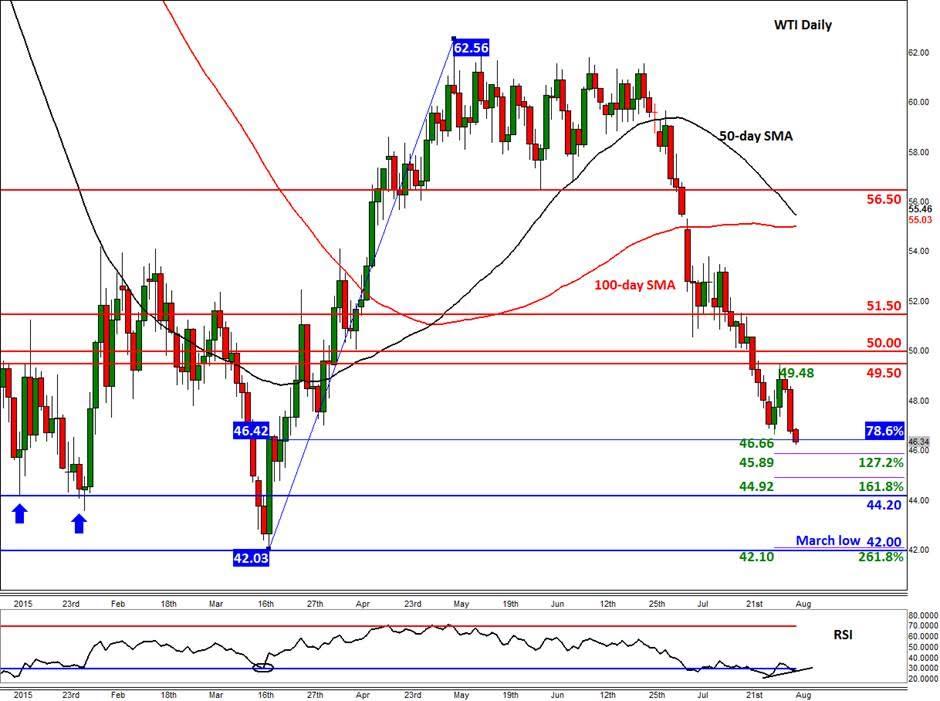
The chart of WTI is unsurprisingly looking anything but constructive. Support after support gets broken due to the abovementioned fundamental forces. As things stand, only a decisive break above the $49.50 resistance level would violate the bearish trend in the short term. Until and unless that happens, the path of least resistance therefore remains to the downside. As such, traders should continue to treat the key potential support levels that they see on their charts as profit-targets rather than long entry points. But apart from a few Fibonacci extension points, there is now not much support seen until $44.20 or the March low around $42.00. Meanwhile the momentum indicator RSI remains in the oversold territory and has not yet confirmed this latest lower low on underlying prices. Thus it points to a potential short-squeeze rally, so do watch out for that possible outcome.
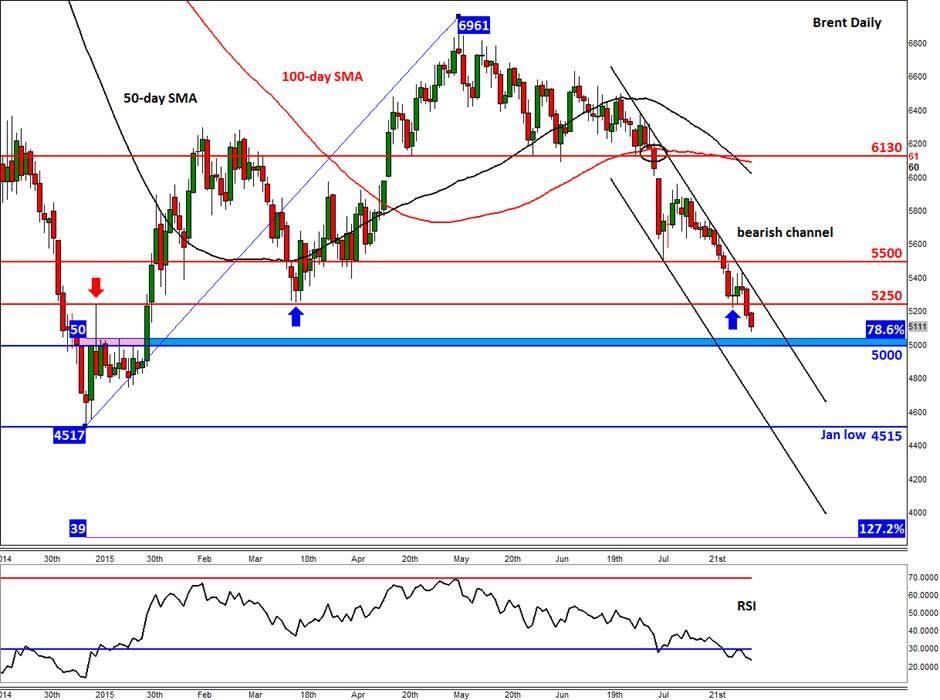
Brent is likewise creating lower lows as it descends towards fresh multi-month lows inside a bearish channel. Having broken the key support at $52.50, this level could now turn into resistance upon re-test. The next potential support to watch is around the $50.00-$50.50 area. Here, the psychologically-important level ties in with the 78.6% Fibonacci retracement level of the upswing from the January low. If broken, the January low itself at $45.20 could be the next target for the bears. As things stand, a decisive break above the key resistance at $55.00 could be a bullish development – the chances of that happening are slim however…
Trading leveraged products such as FX, CFDs and Spread Bets carry a high level of risk which means you could lose your capital and is therefore not suitable for all investors. All of this website’s contents and information provided by Fawad Razaqzada elsewhere, such as on telegram and other social channels, including news, opinions, market analyses, trade ideas, trade signals or other information are solely provided as general market commentary and do not constitute a recommendation or investment advice. Please ensure you fully understand the risks involved by reading our disclaimer, terms and policies.
Recommended Content
Editors’ Picks
EUR/USD holds above 1.0700 ahead of US jobs report

EUR/USD stays in a consolidation phase above 1.0700 after closing the previous two days in positive territory. Investors eagerly await April jobs report from the US, which will include Nonfarm Payrolls and Unemployment Rate readings.
GBP/USD advances to 1.2550, all eyes on US NFP data

The GBP/USD pair trades on a stronger note around 1.2550 amid the softer US Dollar on Friday. Market participants refrain from taking large positions as focus shifts to April Nonfarm Payrolls and ISM Services PMI data from the US.
Gold remains stuck near $2,300 ahead of US NFP

Gold price struggles to gain any meaningful traction and trades in a tight channel near $2,300. The Fed’s less hawkish outlook drags the USD to a multi-week low and lends support to XAU/USD ahead of the key US NFP data.
XRP edges up after week-long decline as Ripple files letter in reply to SEC’s motion

Ripple filed a letter to the court to support its April 22 motion to strike new expert materials. The legal clash concerns whether SEC accountant Andrea Fox's testimony should be treated as a summary or expert witness.
US NFP Forecast: Nonfarm Payrolls gains expected to cool in April

The NFP report is expected to show that the US economy added 243,000 jobs last month, sharply lower than the 303,000 job creation seen in March. The Unemployment Rate is set to stay unchanged at 3.8% in the same period.

