![]()
As my colleague Chris Tedder noted earlier today, the big news in today’s Asian session was undoubtedly China’s quarterly data dump. The marquee GDP report came out 0.1% better than expected at 7.3% y/y, but this reading still represents a 5-year low for growth in the world’s second-largest economy. However, Industrial Production came out surprisingly strong at 8.0% y/y vs. 7.5% eyed and 6.9% last quarter, suggesting that demand for exports from the Middle Kingdom remains strong.
In the wake of China’s data, USDCNH fell to a new 7-month low beneath 6.13, a risk we highlighted in yesterday’s EM Rundown report. Perhaps more importantly for FX traders, the better-than-expected data has caused both AUDUSD and NZDUSD to edge higher. AUDUSD is testing the top of its 2-week symmetrical triangle pattern as we go to press, but NZDUSD may be offering traders an even more actionable setup.
Technical View: NZDUSD
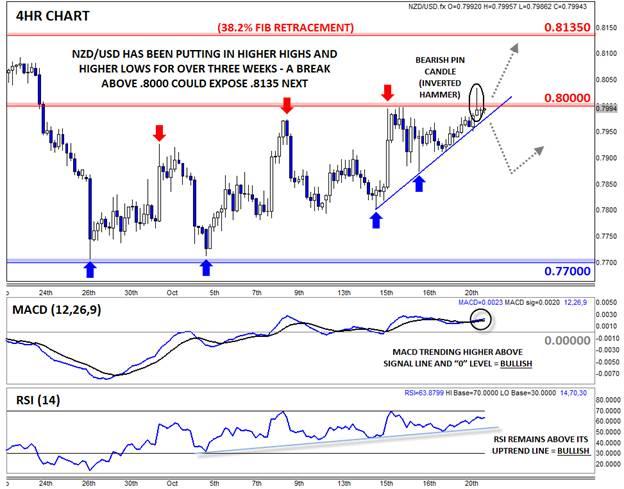
No one is talking about it, but NZDUSD has been quietly putting in higher highs and higher lows for over three weeks since bottoming near .7700 in late September. Looking to the 4hr chart, rates are now testing key resistance at .8000, which represents the convergence of an important psychological level as well as last week’s high.
The pair appeared tried to break through that barrier on last night’s Chinese data, but was quickly rejected back into the upper-.7900s, forming a Bearish Pin Candle*, or inverted hammer, in the process. Often, this pattern marks a near-term top in the market, but given the supportive fundamental picture and lack of followthrough to the downside, the technical outlook remains cautiously optimistic for now. The secondary indicators bolster the bullish case, with the MACD trending higher above its signal line and the “0†level, while the RSI indicator remains above its own bullish trend line.
If we do see a confirmed breakout above .8000 today or later this week, bulls will likely turn their eyes up to the next level of resistance at .8135, which represents the confluence of the 50-day MA and the 38.2% Fibonacci retracement. On the other hand, a break below the near-term bullish trend line would increase the odds of further consolidation below the key .8000 level this week.
A Bearish Pin (Pinnochio) candle, or inverted hammer, is formed when prices rally within the candle before sellers step in and push prices back down to close near the open. It suggests the potential for a bearish continuation if the low of the candle is broken.

This research is for informational purposes and should not be construed as personal advice. Trading any financial market involves risk. Trading on leverage involves risk of losses greater than deposits.
Recommended Content
Editors’ Picks
AUD/USD retargets the 0.6600 barrier and above

AUD/USD extended its positive streak for the sixth session in a row at the beginning of the week, managing to retest the transitory 100-day SMA near 0.6580 on the back of the solid performance of the commodity complex.
EUR/USD keeps the bullish bias above 1.0700

EUR/USD rapidly set aside Friday’s decline and regained strong upside traction in response to the marked retracement in the Greenback following the still-unconfirmed FX intervention by the Japanese MoF.
Gold advances for a third consecutive day

Gold fluctuates in a relatively tight channel above $2,330 on Monday. The benchmark 10-year US Treasury bond yield corrects lower and helps XAU/USD limit its losses ahead of this week's key Fed policy meeting.
Bitcoin price dips to $62K range despite growing international BTC validation via spot ETFs

Bitcoin (BTC) price closed down for four weeks in a row, based on the weekly chart, and could be on track for another red candle this week. The last time it did this was in the middle of the bear market when it fell by 42% within a span of nine weeks.
Japan intervention: Will it work?

Dear Japan Intervenes in the Yen for the first time since November 2022 Will it work? Have we seen a top in USDJPY? Let's go through the charts.