![]()
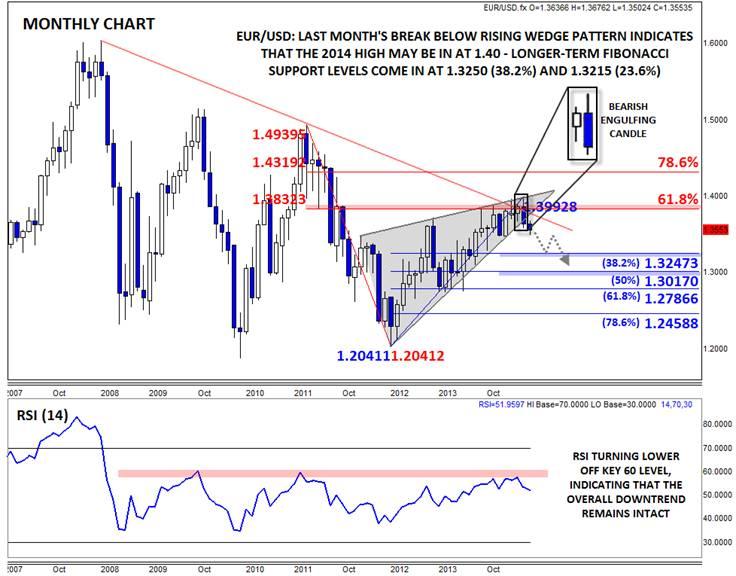
Given all the recent excitement surrounding the EURUSD, traders have been hyper-focused on trading the day-by-day and hour-by-hour swings. However, when high-impact, unprecedented developments come into play (and I’d definitely consider a major central bank opting for a negative deposit rate for the first time in history to be a massive event), it’s important to take a step back and look at a long-term chart. The monthly chart shows a number of bearish technical indications that suggest the EURUSD may have put in a major top around 1.40, and that the pair may generally fall for the rest of the year.
The first pattern that pops out after even a cursory look at the EURUSD’s monthly chart is the 2.5-year rising wedge pattern. Despite the seemingly bullish name, this price action pattern shows that buyers are struggling to push the price higher on each subsequent swing. It is a classic sign of waning buying pressure and points to a big drop once the lower trend line is broken.
While a single pattern alone could easily be shrugged off by euro bulls, the confluence of other bearish technical signs augur for more caution. For one, last month’s high came in directly at converging resistance from a six-year bearish trend line and the 61.8% Fibonacci retracement of the 2011-12 drop. In addition, the pair put in a clear Bearish Engulfing Candle* last month; this formation indicates a strong shift from buying to selling pressure and is often seen at major tops in the market. Finally, the EURUSD’s monthly RSI stalled out and is turning lower off the “60†level, keeping the indicator in bearish territory.
This rare confluence of bearish technical signs indicates that we may have seen the EURUSD’s 2014 high at 1.40 last month, and that rates may continue lower in the second half of the year. To the downside, patient traders may want to watch the Fibonacci retracements of the 2-year rally as possible targets, including 1.3250 (38.2%) and 1.3015 (50%). Of course, any outlook (and especially one so long-term in nature) should always be subject to revision; in this case, we’d have to seriously reconsider the long-term bearish outlook if rates bounce back toward 1.39.
*A Bearish Engulfing candle is formed when the candle breaks above the high of the previous time period before sellers step in and push rates down to close below the low of the previous time period. It indicates that the sellers have wrested control of the market from the buyers.
This research is for informational purposes and should not be construed as personal advice. Trading any financial market involves risk. Trading on leverage involves risk of losses greater than deposits.
Recommended Content
Editors’ Picks
EUR/USD fluctuates near 1.0850 as markets assess Fed commentary

EUR/USD trades in a tight range at around 1.0850 on Tuesday. In the absence of high-tier data releases, the cautious market mood helps the USD hold its ground and limits the pair's upside. Meanwhile, investors continue to scrutinize comments from central bank officials.
GBP/USD stays in positive territory above 1.2700, awaits fresh catalysts

GBP/USD struggles to stretch higher above 1.2700 on Tuesday as the mixed action in Wall Street supports the USD. Investors await fresh catalysts, with several Fed officials and BoE Governor Bailey set to speak later in the session.
Gold rebounds to $2,430 as US yields edge lower

Gold gained traction and climbed to $2,430 area in the American session, turning positive on the day. The pullback in the benchmark 10-year US Treasury bond yield helps XAU/USD stage a rebound following the sharp retreat seen from the all-time high set at the weekly opening at $2,450.
Shiba Inu price flashes buy signal, 25% rally likely Premium

Shiba Inu price has flipped bullish to the tune of the crypto market and breached key hurdles, showing signs of a potential rally. Investors looking to accumulate SHIB have a good opportunity to do so before the meme coin shoots up.
Three fundamentals for the week: UK inflation, Fed minutes and Flash PMIs stand out Premium

Sell in May and go away? That market adage seems outdated in the face of new highs for stocks and Gold. Optimism depends on the easing from central banks – and some clues are due this week.
