Independent mining stocks? Is something bullish brewing here?
The U.S. markets are closed for Independence Day, but we just saw some fireworks in junior mining stocks. Will they rally independently from gold?
Every now and then, miners really do manage to move independently from gold price moves, but this is rare, as ultimately, mining stocks’ revenues (thus profits) depend on the prices of the metals that they mine or are looking for.
In those cases, it could be that it’s the strength of the market is so great that miners’ strong performance simply represents it – and it’s a bullish factor then.
However, in other cases, miners’ strength is very temporary and triggered by some sort of other event.
It's in the context
How can one tell which approach is correct? By looking at the context.
-
What happened beyond the price moves?
-
What kind of volume accompanied the price moves?
-
What happened on an intraday basis?
For example, yesterday, the GDXJ – a proxy for junior mining stocks – moved sharply higher. However, it’s doubtful that this rally will turn into something sustainable. Here’s why:
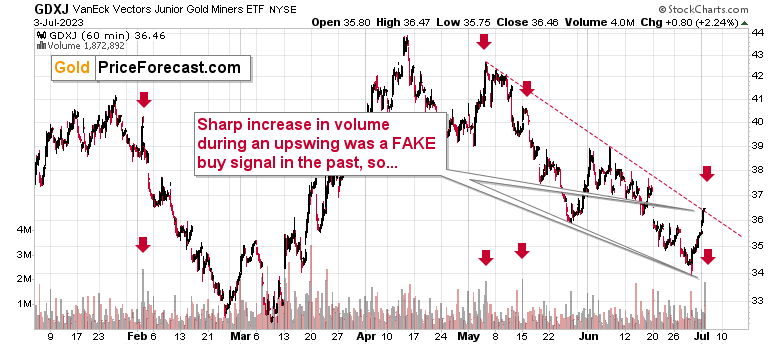
The above chart is based on hourly candlesticks, which means that it provides good trading insight into how the price performed on an intraday basis and what kind of volume accompanied each trading hour.
The price moved sharply higher, but there is something that accompanied that very final part of the rally that we haven’t seen in more than a month. And it completely changed the implications and the prediction for gold prices in July 2023.
Namely, at the very end of the session, the volume spiked. This might not seem like a big deal until you compare it to what happened in previous cases when the same thing happened. There were three such cases earlier this year, and I marked them (and the corresponding price action) with red arrows.
All three out of three cases were rallies that… Were followed by significant declines! The sharper and bigger the move higher, the bigger and more profound the decline followed.
And if this was the case, how can yesterday’s price performance be viewed as bullish?
Especially that GDXJ moved to its declining resistance line?
Gold's resistance line
And speaking of declining resistance lines, gold price moved to its own resistance as well.
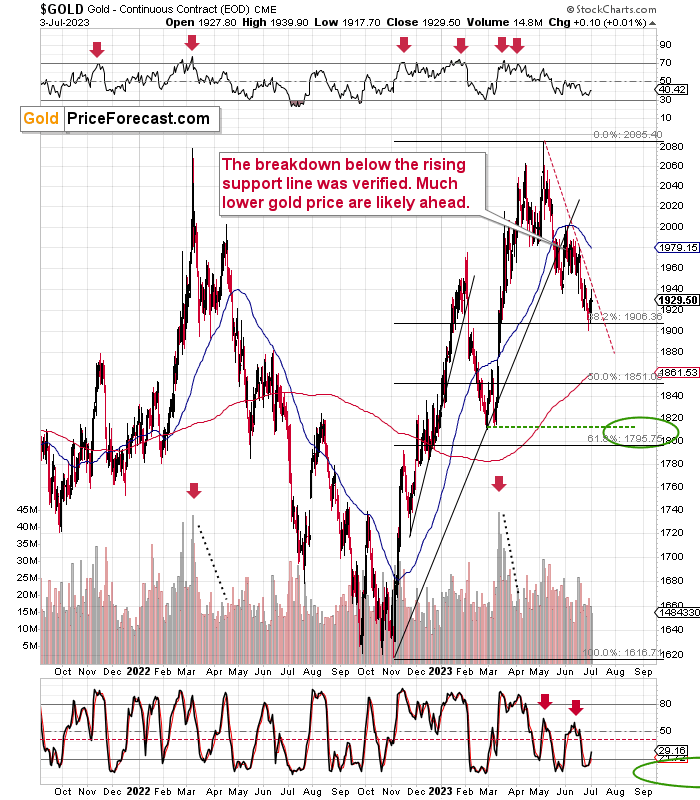
The above chart shows just how tiny the recent upswing was.
Yes, gold moved higher after touching its 38.2% Fibonacci retracement level, but it also reversed after moving to the red dashed line. The upswing materialized on relatively low volume.
In other words, what we saw recently is just a “breather”.
All in all, the current outlook remains bearish, at least for the initial part of the month. We might see a bigger (possibly tradable – allowing us to cash in profits from the short positions) rebound as early as this (or next) week, though.
Want free follow-ups to the above article and details not available to 99%+ investors? Sign up to our free newsletter today!
Want free follow-ups to the above article and details not available to 99%+ investors? Sign up to our free newsletter today!
Author

Przemyslaw Radomski, CFA
Sunshine Profits
Przemyslaw Radomski, CFA (PR) is a precious metals investor and analyst who takes advantage of the emotionality on the markets, and invites you to do the same. His company, Sunshine Profits, publishes analytical software that any


