Gold Price Forecast: XAU/USD’s path of least resistance appears down as US Nonfarm Payrolls data looms
- Gold price breaks lower to hit weekly low near $2,615, eyes a second weekly decline.
- The US Dollar bounces amid a souring mood due to China worries and South Korean political drama.
- Gold price looks south, heading into US Nonfarm Payrolls amid daily bearish RSI and Bear Cross.

Gold's price extends the previous decline to reach a fresh eight-day low near $2,615 early Friday. Gold traders now look forward to the all-important Nonfarm Payrolls (NFP) data for fresh impetus.
Will US Nonfarm Payrolls exacerbate the pain in Gold price?
In the lead-up to the US NFP showdown, the US Dollar (USD) has found fresh demand amid a slight deterioration in risk sentiment and profit-taking.
Investors’ sentiment sags on lingering political tensions in South Korea as the main opposition Democratic Party announced an impeachment motion against President Yoon Suk Yeol will be put to a vote on Saturday, per Asia News.
Further, Yonhap carried headlines citing South Korea's opposition parties saying lawmakers were on standby after receiving many reports for another martial law declaration.
Additionally, persistent worries over China’s economic slowdown and US-Sino trade war undermine the broader market sentiment. Traders are cautious already and resort to repositioning before the US labor data due later in American trading.
Economists expect the US economy to have added 200K jobs in November after creating a meagre 12K jobs in October in the face of hurricanes and the Boeing strike.
If the headline NFP figure comes in below 200K, it would suggest a continued cool down in the US labor market, calling for further rate cuts by the Fed beyond December. The dovish narrative is set to bode well for the non-interest-bearing Gold price at the expense of the USD.
On the other hand, a strong NFP print is likely to strengthen the recent speculation that the Fed could pause its rate-cutting cycle after the expected rate reduction in December. The CME Group’s FedWatch Tool shows that the chances of the Fed lowering rates by 25 basis points (bps) later this month stand at about 70%, slightly down from 75% a day ago.
On Thursday, Gold price snapped its recovery momentum and returned to the red despite the sell-off in the US Dollar and the US Treasury bond yields. The disappointing US weekly Jobless Claims data failed to lift the sentiment around Gold price.
Initial claims for state unemployment benefits rose 9,000 to a seasonally adjusted 224,000 for the week ended Nov. 30, the Labor Department said. Markets had forecast 215,000 claims for the latest week.
Gold price technical analysis: Daily chart
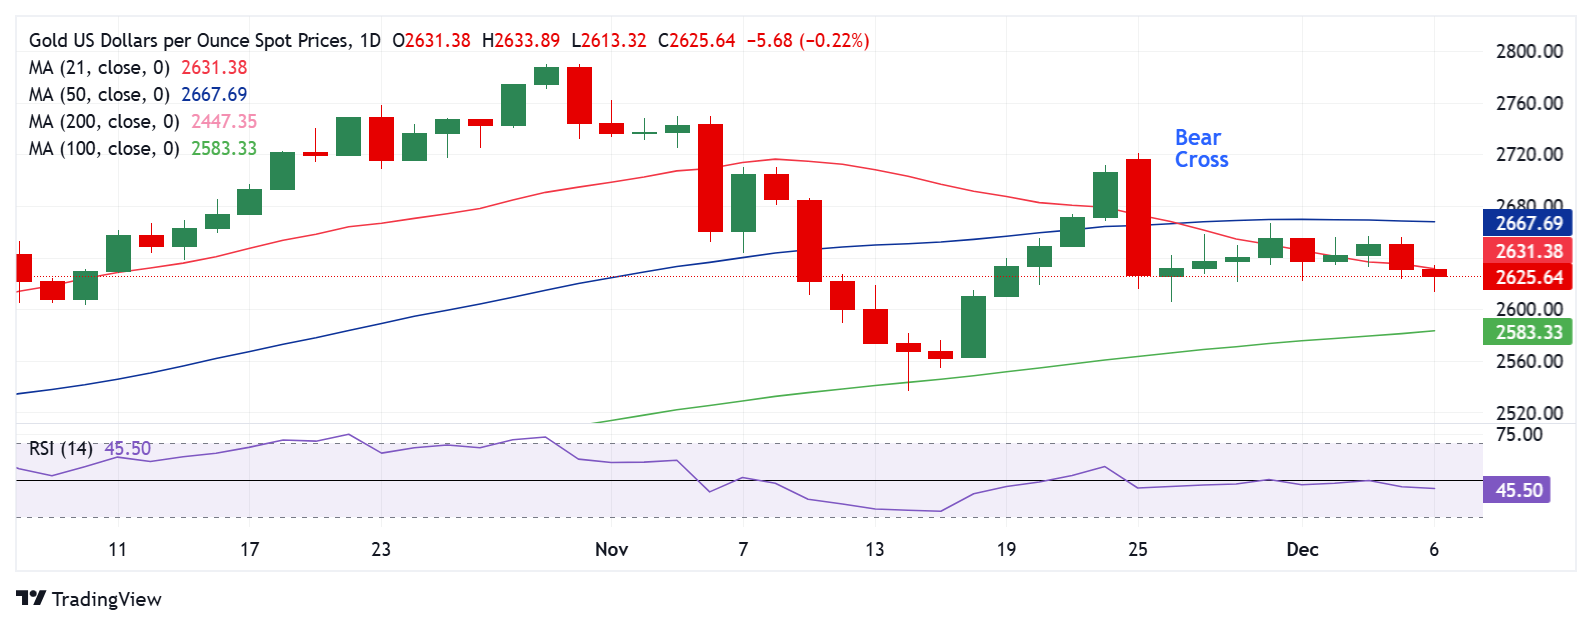
The daily chart shows that Gold's price has broken the recent range to the downside as the 14-day Relative Strength Index (RSI) turns lower below the midline.
Adding credence to the renewed decline in Gold price, the previous week’s Bear Cross continues to act as a headwind.
A daily candlestick closing below the critical short-term 21-day Simple Moving Average (SMA) at $2,631 will likely strengthen the downside.
The next support aligns at the previous week’s low of $2,605, below which the 100-day SMA at $2,583 will be the line in the sand for Gold buyers.
On the flip side, recapturing the 50-day SMA resistance at $2,668 on a sustained basis is critical for buyers to negate the near-term bearish bias.
The next relevant resistance is seen at $2,700, above which the November 25 high of $2,721 will be tested.
Economic Indicator
Nonfarm Payrolls
The Nonfarm Payrolls release presents the number of new jobs created in the US during the previous month in all non-agricultural businesses; it is released by the US Bureau of Labor Statistics (BLS). The monthly changes in payrolls can be extremely volatile. The number is also subject to strong reviews, which can also trigger volatility in the Forex board. Generally speaking, a high reading is seen as bullish for the US Dollar (USD), while a low reading is seen as bearish, although previous months' reviews and the Unemployment Rate are as relevant as the headline figure. The market's reaction, therefore, depends on how the market assesses all the data contained in the BLS report as a whole.
Read more.Next release: Fri Dec 06, 2024 13:30
Frequency: Monthly
Consensus: 200K
Previous: 12K
Source: US Bureau of Labor Statistics
America’s monthly jobs report is considered the most important economic indicator for forex traders. Released on the first Friday following the reported month, the change in the number of positions is closely correlated with the overall performance of the economy and is monitored by policymakers. Full employment is one of the Federal Reserve’s mandates and it considers developments in the labor market when setting its policies, thus impacting currencies. Despite several leading indicators shaping estimates, Nonfarm Payrolls tend to surprise markets and trigger substantial volatility. Actual figures beating the consensus tend to be USD bullish.
Author

Dhwani Mehta
FXStreet
Residing in Mumbai (India), Dhwani is a Senior Analyst and Manager of the Asian session at FXStreet. She has over 10 years of experience in analyzing and covering the global financial markets, with specialization in Forex and commodities markets.