Gold Price Forecast: XAU/USD looks to test $2,050 ahead of key US data
- Gold price bounces toward two-week highs of $2,041 early Tuesday.
- US Dollar sags with US Treasury bond yields, as key economic data awaited.
- Gold price teases a pennant breakout and Bull Cross on the 4H chart.

Gold price is attempting another run toward the two-week highs of $2,041 reached on Friday, as the US Dollar keeps its downbeat tone intact amid renewed weakness in the US Treasury bond yields and ahead of the top-tier US economic data.
Gold buyers take chance as US data looms
A sense of caution prevails in Asian trading early Tuesday, as traders eagerly await a fresh batch of high-impact US economic data, including the Durable Goods Orders and Consumer Confidence, for a fresh signal on the timing of the US Federal Reserve (Fed) policy pivot.
Markets are currently pricing in about an 80% chance of a no rate cut by the Fed in the May meeting while the probability that the Fed will begin lowering rates in June stands at 60%, down from about 70% seen last week.
Hawkish commentaries from Fed policymakers continue to push back against rate cut expectations, helping the US Treasury bond yields find a floor
On Friday, New York Fed President John Williams said that “rate cuts are likely later this year, but only if appropriate.” Meanwhile, Fed Governor Christopher Waller said that there is no rush to begin cutting interest rates.
Early Tuesday, Kansas City Fed President Jeffrey Schmid, a new hawk, noted that there is “no need to preemptively adjust the stance of policy.” “Fed should be patient, wait for convincing evidence that inflation fight has been won,” Schmid added.
However, the US Dollar fails to draw any inspiration ahead of Thursday’s key inflation data release. Therefore, Gold price is looking to extend the previous rebound from the $2,025 support, as traders are likely to refrain from placing fresh bets on the US Dollar before the macro news trickles in.
Gold price technical analysis: Four-hour chart
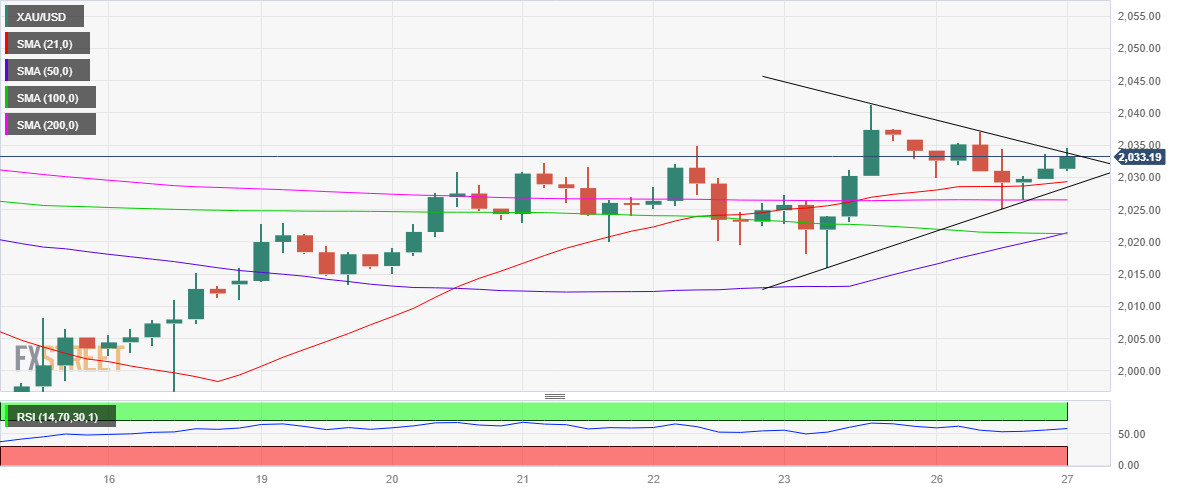
As observed on the four-hour chart, Gold price is teasing an upside break from a pennant formation, testing the falling trendline resistance at $2,034.
Acceptance above that level on a four-hour candlestick closing basis is needed to confirm a bullish breakout.
The 50-Simple Moving Average (SMA) is looking to cut the 100-SMA for the upside. If that happens, it will validate a Bull Cross.
Meanwhile, the Relative Strength Index (RSI) is pointing north above the midline.
Amid potential bullish indicators, the next upside target for Gold price appears a two-week high of $2,041.
Further up, the $2,050 psychological barrier will challenge the bearish commitments.
On the flip side, a failure to resist above the aforementioned trendline resistance at $2,034, Gold price could see a fresh downswing toward the immediate demand area around near $2,028, which is the confluence xone od the 21-, 200-SMAs and the rising trendline support.
A breach of the latter could trigger a fresh drop toward the 50- and 100-SMAs intersection point at $2,021. The line in the sand for Gold buyers is Friday’s low of $2,016.
Gold FAQs
Why do people invest in Gold?
Gold has played a key role in human’s history as it has been widely used as a store of value and medium of exchange. Currently, apart from its shine and usage for jewelry, the precious metal is widely seen as a safe-haven asset, meaning that it is considered a good investment during turbulent times. Gold is also widely seen as a hedge against inflation and against depreciating currencies as it doesn’t rely on any specific issuer or government.
Who buys the most Gold?
Central banks are the biggest Gold holders. In their aim to support their currencies in turbulent times, central banks tend to diversify their reserves and buy Gold to improve the perceived strength of the economy and the currency. High Gold reserves can be a source of trust for a country’s solvency. Central banks added 1,136 tonnes of Gold worth around $70 billion to their reserves in 2022, according to data from the World Gold Council. This is the highest yearly purchase since records began. Central banks from emerging economies such as China, India and Turkey are quickly increasing their Gold reserves.
How is Gold correlated with other assets?
Gold has an inverse correlation with the US Dollar and US Treasuries, which are both major reserve and safe-haven assets. When the Dollar depreciates, Gold tends to rise, enabling investors and central banks to diversify their assets in turbulent times. Gold is also inversely correlated with risk assets. A rally in the stock market tends to weaken Gold price, while sell-offs in riskier markets tend to favor the precious metal.
What does the price of Gold depend on?
The price can move due to a wide range of factors. Geopolitical instability or fears of a deep recession can quickly make Gold price escalate due to its safe-haven status. As a yield-less asset, Gold tends to rise with lower interest rates, while higher cost of money usually weighs down on the yellow metal. Still, most moves depend on how the US Dollar (USD) behaves as the asset is priced in dollars (XAU/USD). A strong Dollar tends to keep the price of Gold controlled, whereas a weaker Dollar is likely to push Gold prices up.
Premium
You have reached your limit of 3 free articles for this month.
Start your subscription and get access to all our original articles.
Author

Dhwani Mehta
FXStreet
Residing in Mumbai (India), Dhwani is a Senior Analyst and Manager of the Asian session at FXStreet. She has over 10 years of experience in analyzing and covering the global financial markets, with specialization in Forex and commodities markets.


