Gold Price Forecast: XAU/USD eyes more upside as focus shifts to US PMI data
- Gold price consolidates near three-month top early Friday, eyes more upside.
- Trump’s tariffs jitters and calls for a lower US Dollar underpin Gold price.
- Gold price keeps sight of the symmetrical triangle target at $2,785 or record highs.

Gold price regains poise and gears up for another run higher early Friday after taking a breather on Thursday. Gold buyers flirt with three-month highs near $2,760, awaiting some clarity on US President Donald Trump’s trade policies and the S&P Global preliminary US business PMI data.
Gold price finds fresh buyers, aims for record highs
Gold price holds onto the recent upside, courtesy of its persistent appeal as a traditional safety asset as markets remain wary of Trump’s tariff and immigration policies and their impact on the economic outlook.
Earlier in the week, Trump announced plans to impose tariffs on imports from Canada, Mexico, China, and the European Union on February 1. However, no further clarity has been provided, leaving investors flocking to safety in the bright metal.
In his Word Economic Forum (WEF) virtual speech, the 47th US President called for a lower US Dollar (USD) and interest rates globally, acting as a headwind for the Greenback while rendering positive for the non-yielding Gold price.
Gold traders now eagerly await the global preliminary Manufacturing and Services PMI reports for January, which could provide fresh insights into the economic prospects on both sides of the Atlantic. Disappointing data could revive global growth fears amid a looming trade war, spooking markets and driving safe-haven flows into the Gold price.
Further, a hawkish interest rate hike delivered by the Bank of Japan (BoJ) could trigger a fresh USD/JPY slide-led USD weakness, supporting the Gold price upisde.
Despite a positive view of the Gold price, the metal could see some pullback late Friday as traders cash in on their long positions heading into next week’s US Federal Reserve (Fed) policy decision and the four-quarter US advance Gross Domestic Product (GDP) data release.
Gold price technical analysis: Daily chart
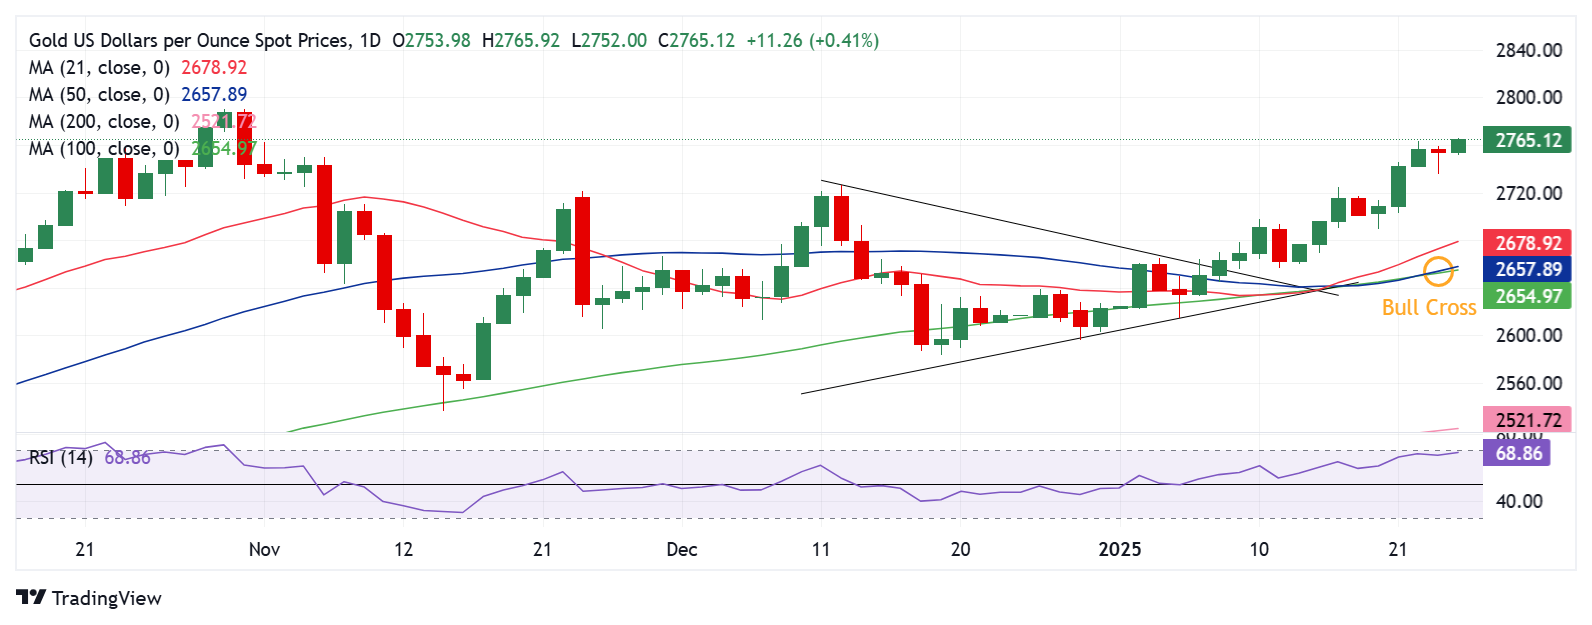
The daily chart shows that the short-term technical outlook remains more or less the same for Gold price.
Gold price remains on track to test the record high of $2,790 or the symmetrical triangle target, measured at $2,785.
Gold price charted a symmetrical triangle breakout earlier this month while it holds comfortably above all the major daily simple moving averages (SMA), supporting the bullish case.
The 14-day Relative Strength Index (RSI) sits beneath the overbought region, currently near 69, justifying the latest leg up.
Adding credence to the constructive outlook, the 50-day SMA closed above the 100-day SMA on Thursday, confirming a Bull Cross.
Gold price must seek a daily closing above the November 2024 high of $2,762 to take on the next target near the aforementioned resistance near $2,790.
Alternatively, Gold price could test the previous day’s low of $2,736 if the pullback sets in.
Sellers will then aim for the $2,700 round level, below which the 21-day SMA at $2,678 will be threatened.
(This story was corrected on January 24 at 7:16 GMT to say that "Adding credence to the constructive outlook, the 50-day SMA closed above the 100-day SMA on Thursday, confirming a Bull Cross," not Bear Cross.)
Economic Indicator
S&P Global Manufacturing PMI
The S&P Global Manufacturing Purchasing Managers Index (PMI), released on a monthly basis, is a leading indicator gauging business activity in the US manufacturing sector. The data is derived from surveys of senior executives at private-sector companies from the manufacturing sector. Survey responses reflect the change, if any, in the current month compared to the previous month and can anticipate changing trends in official data series such as Gross Domestic Product (GDP), industrial production, employment and inflation. A reading above 50 indicates that the manufacturing economy is generally expanding, a bullish sign for the US Dollar (USD). Meanwhile, a reading below 50 signals that activity in the manufacturing sector is generally declining, which is seen as bearish for USD.
Read more.Next release: Fri Jan 24, 2025 14:45 (Prel)
Frequency: Monthly
Consensus: 49.6
Previous: 49.4
Source: S&P Global
Author

Dhwani Mehta
FXStreet
Residing in Mumbai (India), Dhwani is a Senior Analyst and Manager of the Asian session at FXStreet. She has over 10 years of experience in analyzing and covering the global financial markets, with specialization in Forex and commodities markets.


