Gold Price Forecast: XAU/USD eyes critical resistance at $1,850
- XAU/USD is rising for the fourth straight day on Monday.
- Next hurdle for gold is located around $1,850.
- A technical correction could be witnessed before the next leg up.

The XAU/USD pair registered its best weekly performance of 2021 last week and gained more than 3%. The sharp decline seen in the US Treasury bond yields and the heavy selling pressure surrounding the greenback allows gold to preserve its bullish momentum on Monday. At the moment, the pair is up 0.4% on the day at $1,839.
The April jobs report from the US showed on Friday that Nonfarm Payrolls increased by 266,000. This reading missed analysts' estimate of 978,000 by a large margin and triggered a USD selloff as it reaffirmed the Fed's dovish stance while easing concerns over the US economy overheating.
The negative impact of the disappointing US labour market data is still being felt in the markets on Monday with the US Dollar Index slumping to its lowest level since late February near 90.00. Moreover, the benchmark 10-year US T-bond yield stays in the negative territory at 1.579% at the time of press, helping gold continue to find demand.
In the absence of high-tier macroeconomic data releases from the US, the USD's market valuation is likely to drive XAU/USD's movements in the remainder of the day.
Gold technical outlook
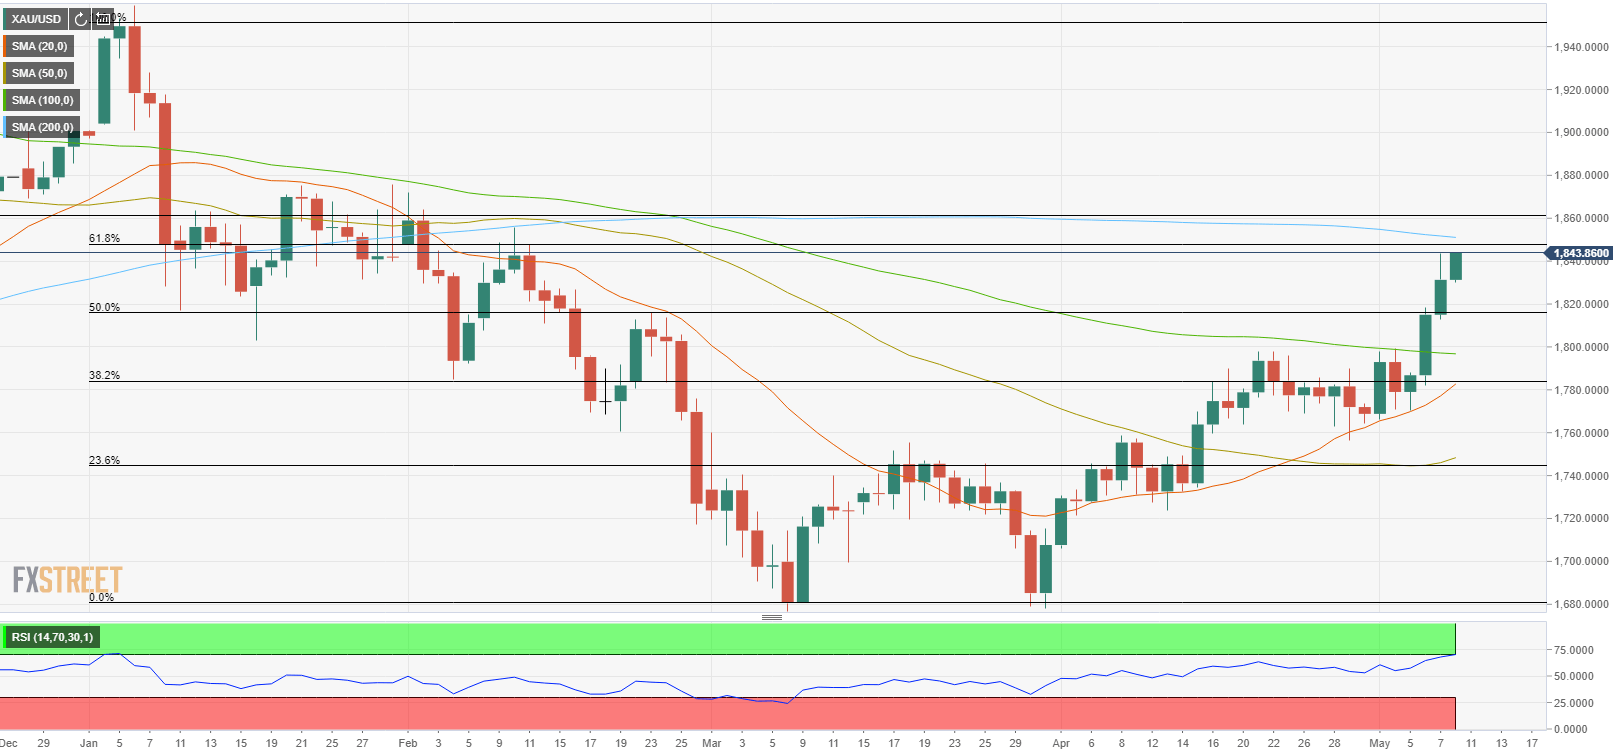
On the daily chart, the Relative Strength Index (RSI) indicator stays near 70. The last time RSI rose above that level back in early January, XAU/USD staged a deep correction and lost more than 5% in less than a week. Although the pair is unlikely to make a similar correction in the current fundamental setup, it could still retreat before the next leg up.
On the downside, $1,820 (Fibonacci 50% retracement of the January-March downtrend) could be seen as the first support level ahead of $1,800 (psychological level, 100-day SMA). Only a daily close above the latter could discourage buyers and eliminate the near-term bullish outlook.
On the other hand, the initial target is located at $1,850, where the Fibonacci 61.8% retracement level meets the 200-day SMA. If gold manages to rise above that hurdle and turn it into support, it could aim for $1,860 (static level).
Premium
You have reached your limit of 3 free articles for this month.
Start your subscription and get access to all our original articles.
Author

Eren Sengezer
FXStreet
As an economist at heart, Eren Sengezer specializes in the assessment of the short-term and long-term impacts of macroeconomic data, central bank policies and political developments on financial assets.


