Gold Price Forecast: XAU/USD eyes a weekly close above $2,050 and US ISM PMI
- Gold price sits at four-week highs of $2,051, eyeing a second straight weekly gain.
- US Dollar keeps the red with the Treasury yields after soft US Core PCE inflation data.
- Gold price confirmed a pennant breakout on the daily chart on Thursday.

Gold price is consolidating near four-week highs of $2,051, gathering pace for the next push higher. A renewed weakness in the US Dollar (USD) alongside the US Treasury bond yields is prompting Gold buyers to take a breather ahead of another top-tier US economic data in the ISM Manufacturing PMI due later on Friday. ahead of the all-important data due later in the day.
Gold price eyes US ISM PMI for further upside
The US Dollar is seeing a fresh selling interest against its major counterparts after two straight days of gains, as risk sentiment remains in a sweeter spot on the final trading day of the week. Sluggish performance in the US Treasury bond yields could be also attributed to the underlying downbeat tone around the Greenback.
Gold price is holding its three-day winning streak amid a broadly softer US Dollar and the US Treasury bond yields, also benefiting from the improvement in the Chinese services and manufacturing sector activity, as shown by the latest data from China’s National Bureau of Statistics (NBS) and Caixin. China is the world’s top Gold consumer.
The NBS Non-Manufacturing PMI improved to 51.4 in February versus 50.7 in January, stronger than the estimation of 50.8. Further, China's Caixin Manufacturing Purchasing Managers' Index (PMI) rose to 50.9 in February when compared to the January reading of 50.8, above the market consensus of 50.6.
Gold price rose more than 0.50% in Thursday’s North American trading after the release of the US Core Personal Consumption Expenditures - Price Index (PCE) Index, which was aligned with estimates of 2.8% YoY in January but eased from December’s 2.9% increase. Softening of the US Federal Reserve’s (Fed) favorite inflation gauge toward its 2.0% target briefly knocked down the US Dollar while sending Gold price to the key $2,050 threshold.
However, the upside in the Gold price was contained by the hawkish commentaries from the Fed policymakers. Atlanta Fed President Raphael Bostic said the recent data shows the road back to the central bank’s 2% inflation goal will be “bumpy.” Chicago Fed President Austan Goolsbee, also speaking Thursday, said he expects rate cuts later this year but didn’t specify when.
Looking ahead, the focus remains on the US ISM Manufacturing PMI data and the end-of-the-week flows for fresh trading impetus in Gold price. The ISM PMI data will help shed more light on the Fed’s timing of the interest rate cut.
Markets are currently pricing in just about a 20% chance that the US Federal Reserve (Fed) could begin easing rates in May, much lower than an over 90% chance a month ago, according to the CME FedWatch Tool. For the June meeting, the probability of a rate cut now stands at about 65%.
Gold price technical analysis: Daily– chart
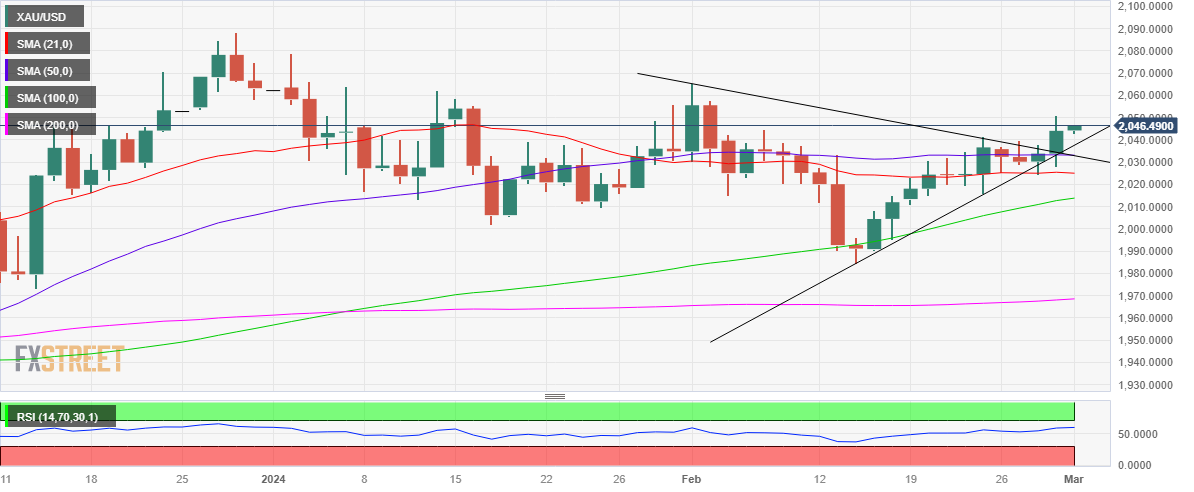
As observed on the daily chart, Gold price confirmed an upside break from a symmetrical triangle on Thursday after closing above the $2,034 key resistance.
The 14-day Relative Strength Index (RSI) is holding comfortably above the midline, suggesting that there is more room for the upside.
The immediate resistance is now seen at the four-week high of $2,051, acceptance above which on a daily closing basis could initiate a fresh uptrend toward the static resistance of $2,065.
Further up, the $2,070 round level will be put to the test.
On the other side, the initial demand area is seen at the previous two-week highs of $2,041, below which the 50-day Simple Moving Average (SMA) at $2,034 will be challenged.
If Gold sellers manage to find a strong foothold below the latter, the 21-day SMA at $2,025 will be next on sellers’ radars.
Further down, the 100-day SMA at $2,014 could offer some temporary support to Gold buyers.
Gold FAQs
Why do people invest in Gold?
Gold has played a key role in human’s history as it has been widely used as a store of value and medium of exchange. Currently, apart from its shine and usage for jewelry, the precious metal is widely seen as a safe-haven asset, meaning that it is considered a good investment during turbulent times. Gold is also widely seen as a hedge against inflation and against depreciating currencies as it doesn’t rely on any specific issuer or government.
Who buys the most Gold?
Central banks are the biggest Gold holders. In their aim to support their currencies in turbulent times, central banks tend to diversify their reserves and buy Gold to improve the perceived strength of the economy and the currency. High Gold reserves can be a source of trust for a country’s solvency. Central banks added 1,136 tonnes of Gold worth around $70 billion to their reserves in 2022, according to data from the World Gold Council. This is the highest yearly purchase since records began. Central banks from emerging economies such as China, India and Turkey are quickly increasing their Gold reserves.
How is Gold correlated with other assets?
Gold has an inverse correlation with the US Dollar and US Treasuries, which are both major reserve and safe-haven assets. When the Dollar depreciates, Gold tends to rise, enabling investors and central banks to diversify their assets in turbulent times. Gold is also inversely correlated with risk assets. A rally in the stock market tends to weaken Gold price, while sell-offs in riskier markets tend to favor the precious metal.
What does the price of Gold depend on?
The price can move due to a wide range of factors. Geopolitical instability or fears of a deep recession can quickly make Gold price escalate due to its safe-haven status. As a yield-less asset, Gold tends to rise with lower interest rates, while higher cost of money usually weighs down on the yellow metal. Still, most moves depend on how the US Dollar (USD) behaves as the asset is priced in dollars (XAU/USD). A strong Dollar tends to keep the price of Gold controlled, whereas a weaker Dollar is likely to push Gold prices up.
Premium
You have reached your limit of 3 free articles for this month.
Start your subscription and get access to all our original articles.
Author

Dhwani Mehta
FXStreet
Residing in Mumbai (India), Dhwani is a Senior Analyst and Manager of the Asian session at FXStreet. She has over 10 years of experience in analyzing and covering the global financial markets, with specialization in Forex and commodities markets.


