Gold Price Forecast: XAU/USD buyers stay hopeful while $2,480 holds ahead of US ISM
- Gold price remains in the red for the third day in a row on Tuesday, below $2,500.
- The US Dollar clings to recovery amid China-led dour mood and positive Treasury bond yields.
- Eyes turn to US ISM PMI, as Gold buyers look to defend 21-day SMA at $2,480 amid bullish daily RSI.

Gold price is trading under pressure just below the $2,500 mark early Tuesday, consolidating the three-day downtrend after hitting fresh weekly lows. Gold price now looks forward to the top-tier US ISM Manufacturing PMI data for the next directional move.
Gold price eyes US ISM Manufacturing PMI before key jobs data
Gold price has been bearing the brunt of fading hopes of a 50 basis points (bps) interest-rate cut by the US Federal Reserve (Fed) this month, following the release of the July US core Personal Consumption Expenditures (PCE) Price Index on Friday. The Fed’s preferred inflation measure, rose 2.6% YoY and 0.2% MoM in August almost in line with expectations.
Markets continue trimming bets for a big rate cut by the US central bank at its September 17-18 policy meeting, currently pricing in a 31% chance of such a move and a 69% probability of a 25 bps cut, according to CME Group’s FedWatch tool.
Expectations of a less aggressive Fed easing cycle have allowed the US Dollar (USD) to recover ground, as it now hovers near weekly highs against its major rivals. The US Dollar resurgence continues to render negative for the USD-denominated Gold price, as US Treasury bond yields also hold onto their previous week’s gains.
However, it remains to be seen if the Gold price downside sustains, as traders eagerly await Friday’s US Nonfarm Payrolls data to gauge the size of the Fed's expected rate cut this month.
Ahead of that, Gold traders could take cues from the US ISM Manufacturing PMI data due later on Tuesday and Wednesday’s Job Openings and ADP Employment Change data on Thursday. The headline ISM Manufacturing PMI is seen improving to 47.5 in August after contracting to 46.8 in July. The Price Paid component is expected to ease to 52.5 in August from July’s 52.9.
A downside surprise in the headline ISM figure or a bigger-than-expected slowdown in the Price Paid Index could revive hopes of a 50 bps Fed rate cut later in the month, weighing on the US Dollar recovery momentum and vice-versa. Markets, however, will be cautious, as US traders return from an extended weekend holiday and also ahead of the critical employment data.
Gold price technical analysis: Daily chart
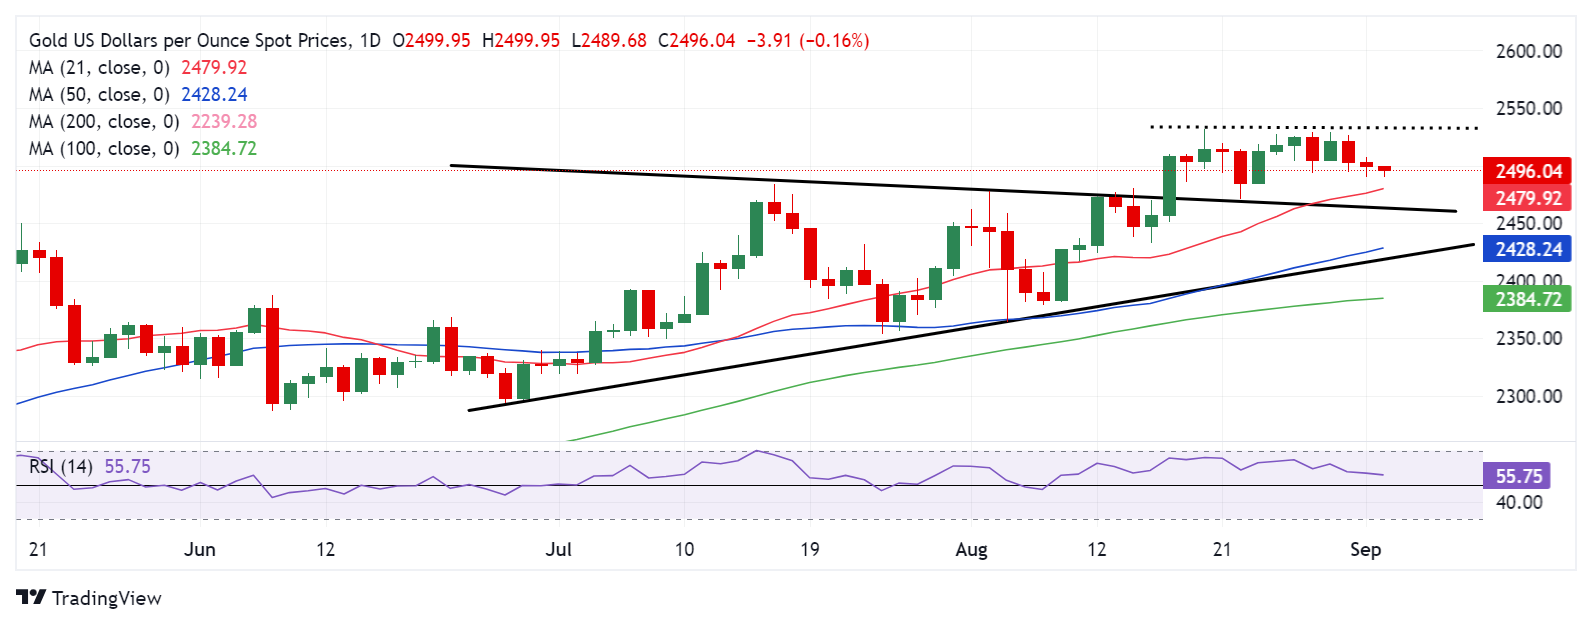
From a short-term technical perspective. Gold buyers remain hopeful so long as they hold above the 21-day Simple Moving Average (SMA) at $2,480.
The 14-day Relative Strength Index (RSI) points lower toward the 50 level, justifying the ongoing weakness in Gold price. However, the leading indicator still sits within the bullish territory, implying a ‘buy-the-dip’ opportunity.
If the decline extends, Goild price could challenge the 21-day SMA at $2,480, below which the symmetrical triangle resistance-turned-support at $2,464 will come into play.
Defending the latter is critical to sustain the August uptrend for Gold buyers. A fresh downtrend would initiate below that support level, with sellers aiming for the $2,420 area, where the triangle support line and the 50-day SMA close in.
However, should Gold buyers defend the 21-day SMA at $2,480 and recapture the $2,500 level on a daily closing basis, the uptrend could resume toward the record high of $2,532.
Economic Indicator
ISM Manufacturing PMI
The Institute for Supply Management (ISM) Manufacturing Purchasing Managers Index (PMI), released on a monthly basis, is a leading indicator gauging business activity in the US manufacturing sector. The indicator is obtained from a survey of manufacturing supply executives based on information they have collected within their respective organizations. Survey responses reflect the change, if any, in the current month compared to the previous month. A reading above 50 indicates that the manufacturing economy is generally expanding, a bullish sign for the US Dollar (USD). A reading below 50 signals that factory activity is generally declining, which is seen as bearish for USD.
Read more.Next release: Tue Sep 03, 2024 14:00
Frequency: Monthly
Consensus: 47.5
Previous: 46.8
Source: Institute for Supply Management
The Institute for Supply Management’s (ISM) Manufacturing Purchasing Managers Index (PMI) provides a reliable outlook on the state of the US manufacturing sector. A reading above 50 suggests that the business activity expanded during the survey period and vice versa. PMIs are considered to be leading indicators and could signal a shift in the economic cycle. Stronger-than-expected prints usually have a positive impact on the USD. In addition to the headline PMI, the Employment Index and the Prices Paid Index numbers are watched closely as they shine a light on the labour market and inflation.
Premium
You have reached your limit of 3 free articles for this month.
Start your subscription and get access to all our original articles.
Author

Dhwani Mehta
FXStreet
Residing in Mumbai (India), Dhwani is a Senior Analyst and Manager of the Asian session at FXStreet. She has over 10 years of experience in analyzing and covering the global financial markets, with specialization in Forex and commodities markets.


