Gold Price Forecast: XAU/USD awaits a range breakout but not so soon, NFP in focus
- Mixed sentiment and USD plays confine gold price in a tight range.
- Gold’s four-hour technical setup shows a lack of clear directional bias.
- US NFP holds the key but ADP and ISM Services PMI eyed in the meantime.

Gold price ended in the red for the third straight session on Tuesday, as traders preferred to stay on the sidelines ahead of the key US Nonfarm Payrolls release, which will provide fresh signals on the Fed’s next policy action. The US dollar traded mostly mixed against its six major rivals, in absence of a strong catalyst, as markets fretted over growing covid cases globally and China’s clampdown on the technology sector. Meanwhile, gold price suffered at the hands of the hawkish comments from two of the Fed policymakers, as they supported a potential taper plan amid an improvement in the US labor market. However, the recent weakness in the US Treasury yields helped gold price hold its footing abov\e the $1800 mark.
Heading into a busy docket this Wednesday, gold price is attempting a comeback, as the dollar remains on the defensive amid a cautious market mood and a minor bounce in the Treasury yields. From a broader perspective, the greenback remains pressured amid the dovish Fed and weak US economic data while covid concerns help put a floor under the buck.
Looking forward, gold price is likely to waver in a narrow range as investors await fresh hints from the US ADP jobs data on the labor market recovery. Also, of note remains the US ISM Services PMI data, impacting the dollar valuations, in turn, gold price.
Gold Price Chart - Technical outlook
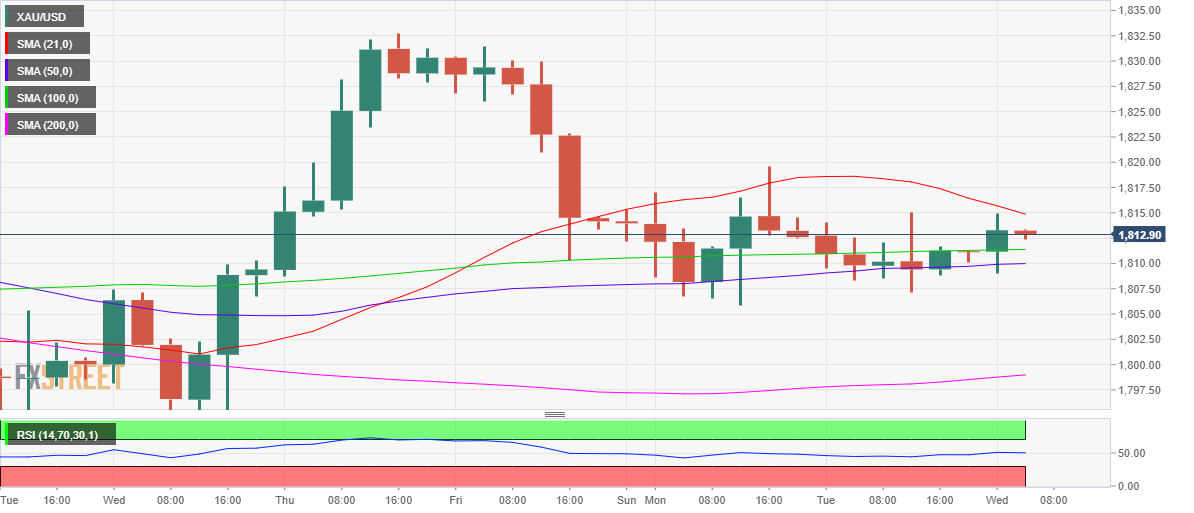
Gold: Four-hour chart
The four-hour technical setup for gold price shows that the downward-sloping 21-Simple Moving Average (SMA) at $1815 is testing the bulls’ commitment, as the range play above $1800 extends.
On the other hand, the mildly bullish 50-SMA at $1810 is protecting the downside. Note that the price has not given a four-hourly candlestick closing below the latter since Tuesday’s mid-European session.
A range breakout is imminent in either direction, although with the Relative Strength Index (RSI) holding flat at the midline, gold traders lack a clear directional bias for now.
A sustained break above the 21-SMA could boost the buying interest, with gold bulls targeting the August 2 highs at $1820.
However, the 50-SMA support caves in on a sustained basis, then gold price could see a sharp drop towards the ascending 200-SMA at $1799. Ahead of that the August 2 lows of $1806 could be put at test.
Author

Dhwani Mehta
FXStreet
Residing in Mumbai (India), Dhwani is a Senior Analyst and Manager of the Asian session at FXStreet. She has over 10 years of experience in analyzing and covering the global financial markets, with specialization in Forex and commodities markets.

















