Gold Price Forecast: Will XAU/USD retake $2,400 on softer US CPI inflation?
- Gold price extends its recovery momentum toward $2,400 on US CPI day.
- The US Dollar nurses losses with Treasury bond yields, as risk flows dominate on Fed rate cut bets.
- Gold price keeps eyes on $2,400 and US CPI inflation data amid bullish daily technical setup.

Gold price is extending its upbeat momentum into a third consecutive day on Thursday, eagerly looking forward to the US Consumer Price Index (CPI) data release later in the day to seal in a US Federal Reserve (Fed) interest rate cut in September.
All eyes remain on US CPI report
Following a brief pause in the Gold price recovery following round one of Fed Chair Jerome Powell’s testimony on Tuesday, buyers regained control on Wednesday after Powell’s second congressional appearance.
Powell’s caution on loosening labor market conditions suggested a September rate cut is likely on the cards, knocking off the US Dollar (USD) once again alongwith the US Treasury bond yields. Heightening dovish Fed expectations fuelled a risk-on rally on Wall Street, which exerted additional downside pressure on the safe-haven Greenback.
Broad US Dollar weakness, Gold price made another run toward $2,400 but failed due to risk appetite, diminishing the demand for the non-yielding Gold price.
On Thursday, risk flows extend into Asian trading, keeping Gold price afloat at the expense of the US Dollar. Meanwhile, the modest uptick in the US Treasury bond yields seems to lack conviction, in the face of the expected slowdown in the annual US CPI inflation data for June.
The US CPI is seen rising 3.1% YoY in June, slowing from a 3.3% increase in May while the annual core CPI inflation is likely to steady at 3.4% in the same period. On a monthly basis, CPI is set to rise 0.1% while core CPI is seen up by 0.2%.
A softer-than-expected US headline annual CPI data or a downside surprise in the monthly inflation figure could affirm a September Fed rate cut while boosting odds for another rate cut in December. Conversely, hot inflation data could push back against Fed rate cuts as early as September.
In the former case, Gold price could storm through the roof and retest all-time highs, as the US Dollar is likely to melt with the yields. However, hot US inflation data could sink Gold price toward $2,300.
Markets are currently pricing in a 74% chance that the Fed will lower rates in September, according to the CME Group’s FedWatch Tool.
Besides, speeches from Fed officials and US President Joe Biden could also have some bearing on the USD-denominated Gold price. Biden could express his take on the June inflation data and the timing of the Fed rate cut. Also, markets could focus on his comments on the nomination issue amid long-simmering concerns about Biden's age and whether he's fit to serve a second term as a US President.
Gold price technical analysis: Daily chart
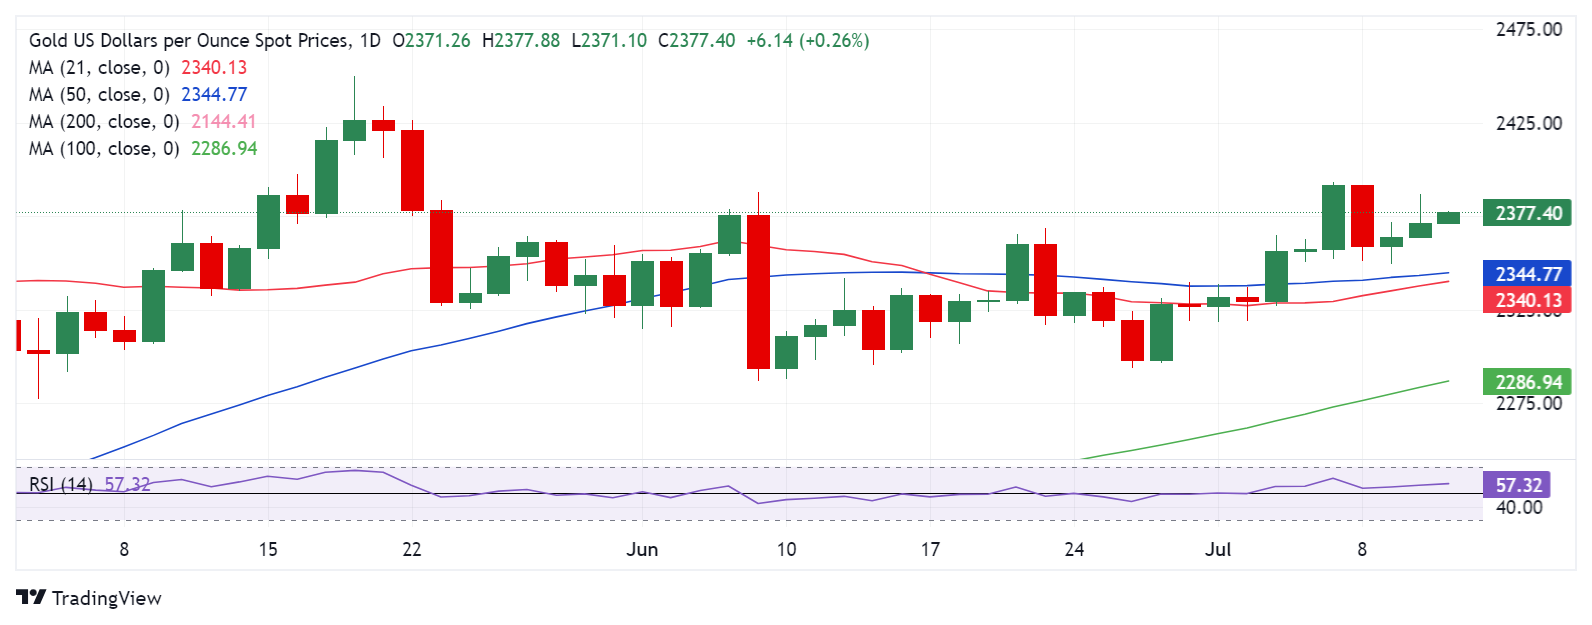
The short-term technical outlook for Gold price continues to lean in favor of buyers, as the 14-day Relative Strength Index (RSI) points north above the 50 level.
Gold buyers need to find acceptance above the six-week high of $2,393 to resume the uptrend toward the all-time high of $2,450. Ahead of that, the $2,400 level could act as a tough nut to crack for them.
On the downside, Gold price could face immediate support at the $2,350 psychological barrier, below which the $2,340 demand area will be challenged.
Around that level, the 50-day Simple Moving Average (SMA) and the 21-day SMA close in. A sustained move below the latter could trigger a fresh downtrend toward the $2,300 round level.
Economic Indicator
Consumer Price Index (YoY)
Inflationary or deflationary tendencies are measured by periodically summing the prices of a basket of representative goods and services and presenting the data as The Consumer Price Index (CPI). CPI data is compiled on a monthly basis and released by the US Department of Labor Statistics. The YoY reading compares the prices of goods in the reference month to the same month a year earlier.The CPI is a key indicator to measure inflation and changes in purchasing trends. Generally speaking, a high reading is seen as bullish for the US Dollar (USD), while a low reading is seen as bearish.
Read more.Next release: Thu Jul 11, 2024 12:30
Frequency: Monthly
Consensus: 3.1%
Previous: 3.3%
Source: US Bureau of Labor Statistics
The US Federal Reserve has a dual mandate of maintaining price stability and maximum employment. According to such mandate, inflation should be at around 2% YoY and has become the weakest pillar of the central bank’s directive ever since the world suffered a pandemic, which extends to these days. Price pressures keep rising amid supply-chain issues and bottlenecks, with the Consumer Price Index (CPI) hanging at multi-decade highs. The Fed has already taken measures to tame inflation and is expected to maintain an aggressive stance in the foreseeable future.
Premium
You have reached your limit of 3 free articles for this month.
Start your subscription and get access to all our original articles.
Author

Dhwani Mehta
FXStreet
Residing in Mumbai (India), Dhwani is a Senior Analyst and Manager of the Asian session at FXStreet. She has over 10 years of experience in analyzing and covering the global financial markets, with specialization in Forex and commodities markets.


