Gold Price Forecast: Will US Nonfarm Payrolls drive XAU/USD to fresh record highs?
- Gold price extends a side trend below the key $2,670 resistance amid the Israel-Iran conflict.
- The US Dollar eases off six-week highs, as traders reposition ahead of the Nonfarm Payrolls data.
- Gold price stays above all key daily averages and the RSI hangs in the bullish zone, pointing to a fresh upside.

Gold price is extending its consolidative phase below the key $2,670 static resistance for the third straight day. Gold traders look forward to the high-impact US Nonfarm Payrolls (NFP). data for the next push higher, as the Middle East geopolitical escalation persists.
US Nonfarm Payrolls hold key for next Gold price direction
Heading into the US NFP showdown, traders are resorting to position readjustment by way of profit-taking on the recent US Dollar (USD) rally, injecting fresh signs of life in Gold price. The Greenback retreats early Friday after hitting six-week highs against its major rivals on Thursday, courtesy of the recent strong US employment and ISM Services PMI data. Encouraging US economic data have eased bets for a 50 basis points interest rate cut by the Federal Reserve (Fed) in November.
Data on Wednesday showed that US ADP private sector employment increased by 143,000 jobs for September, accelerating from the upwardly revised 103,000 in August and better than the 120,000 estimate. Meanwhile, US ISM Services PMI jumped from 51.5 to 54.9 in September, above the forecast of 51.7 while marking the highest reading since February 2023.
Markets are currently pricing in about a 34% chance that the Fed will opt for a big rate cut at its next meeting, compared with almost 60% last week, CME Group's FedWatch Tool shows. The non-interest-bearing Gold price struggles amid reduced bets for aggressive Fed easing. However, the Gold price downside remains cushioned due to the intensifying geopolitical tensions between Iran and Israel.
Following Iran's missile attacks on Israel to avenge the killings of of leaders of the Tehran-back militant group Hezbollah last week, Israel responded by striking an apartment in central Beirut, which killed nine people. The Lebanese Army returned Israeli fire for the first time in nearly a year of fighting between Israel and Hezbollah. Mounting risks of the Israel-Iran conflict turning into a wider regional war in the Middle East continue to lend support to the traditional safe-haven Gold price.
The next direction in Gold price, however, will be determined by the upcoming US payrolls data, which is expected to show that the economy added 140K jobs in September, against August’s 142K gain. The Unemployment Rate is set to hold steady at 4.2% in the same period while the annual Average Hourly Earnings are likely to grow by 3.8% in September, at the same pace seen in August.
An upside surprise to the headline NFP figure and the wage inflation data could bolster bets for a 25 bps Fed rate cut in November, adding extra legs to the US Dollar recovery at the expense of Gold price. In contrast, a big disappointment could revive expectations that the Fed would opt for an outsized rate reduction at its next meeting, smashing the USD across the board. In such a case, Gold price could jump back toward the record high of $2,686.
The US labor market report will the hold key for the Gold price action while traders will also closely eye a speech from New York Fed President John Williams for fresh policy cues.
Gold price technical analysis: Daily chart
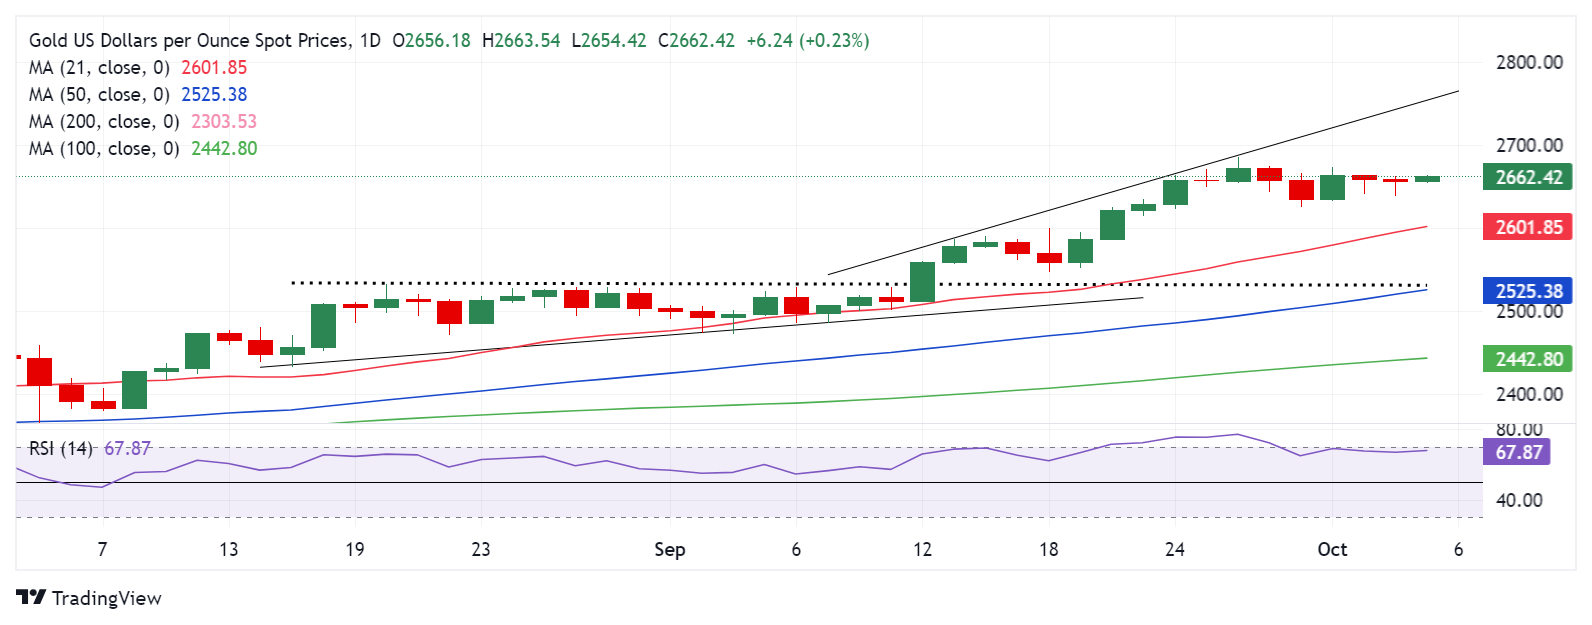
The short-term technical outlook for Gold price remains more or less the same, with buyers motivated so long as the 14-day Relative Strength Index (RSI) holds within the bullish zone. The leading indicator is currently trading near 68.
Gold price needs to yield a daily candlestick closing above the static resistance near $2,670 for a fresh upside. The next resistance is aligned at the record high of $2,686.
Further up, buyers will target the $2,700 round level, followed by the rising trendline resistance, now at $2,752.
On the flip side, acceptance below the September 24 low of $2,623 is critical to unleashing further downside toward the $2,600 threshold, where the 21-day Simple Moving Average (SMA) coincides.
Gold sellers could then challenge the September 20 low of $2,585.
Economic Indicator
Nonfarm Payrolls
The Nonfarm Payrolls release presents the number of new jobs created in the US during the previous month in all non-agricultural businesses; it is released by the US Bureau of Labor Statistics (BLS). The monthly changes in payrolls can be extremely volatile. The number is also subject to strong reviews, which can also trigger volatility in the Forex board. Generally speaking, a high reading is seen as bullish for the US Dollar (USD), while a low reading is seen as bearish, although previous months' reviews and the Unemployment Rate are as relevant as the headline figure. The market's reaction, therefore, depends on how the market assesses all the data contained in the BLS report as a whole.
Read more.Next release: Fri Oct 04, 2024 12:30
Frequency: Monthly
Consensus: 140K
Previous: 142K
Source: US Bureau of Labor Statistics
America’s monthly jobs report is considered the most important economic indicator for forex traders. Released on the first Friday following the reported month, the change in the number of positions is closely correlated with the overall performance of the economy and is monitored by policymakers. Full employment is one of the Federal Reserve’s mandates and it considers developments in the labor market when setting its policies, thus impacting currencies. Despite several leading indicators shaping estimates, Nonfarm Payrolls tend to surprise markets and trigger substantial volatility. Actual figures beating the consensus tend to be USD bullish.
Premium
You have reached your limit of 3 free articles for this month.
Start your subscription and get access to all our original articles.
Author

Dhwani Mehta
FXStreet
Residing in Mumbai (India), Dhwani is a Senior Analyst and Manager of the Asian session at FXStreet. She has over 10 years of experience in analyzing and covering the global financial markets, with specialization in Forex and commodities markets.


