Gold Price Forecast: For how long can XAU/USD defend the key daily support?
- Gold price snaps a five-day downtrend early Thursday.
- Markets turn cautious, as Middle East geopolitical woes return to the fore.
- The US Dollar and the US Treasury bond yields weaken amid persistent dovish Fed bets.
- Gold price awaits a symmetrical triangle breakdown confirmation on the daily chart.

Gold price is attempting a tepid bounce while below $2,400 early Thursday, pausing a five-day losing streak, as the US Dollar (USD) sees fresh selling alongside the US Treasury bond yields.
Gold price comes up for air, Iran-Israel conflict in focus
Despite a cautious market mood, in the face of resurfacing Middle East geopolitical tensions, the USD remains broadly subdued. A pullback in the US Treasury bond yields drags the Greenback lower. Risk-off flows return and lift the demand for the US government bonds, knocking down the yields while lifting Gold price.
Citing two sources familiar with intelligence on the matter, CNN News reported late Wednesday that Hezbollah appears increasingly set to act against Israel “independent” of an expected Iranian response to the recent killing of two terror leaders. According to CNN, multiple officials say Iran seems to still be hashing out its retaliation plans.
Meanwhile, markets speculate over aggressive US Federal Reserve (Fed) easing this year, as economic slowdown risks lurk, keeping the downbeat tone intact around the US Dollar. Markets are now pricing in a 75% chance of the Fed cutting rates by 50 basis points (bps) in September, the CME Group's FedWatch tool showed, with major brokerages also anticipating a large rate cut in the next meeting, per Reuters.
Looking ahead, Traders will closely monitor the developments surrounding the potential Iranian attack on Israel, which if happens will likely provide extra legs to the rebound In Gold price. Meanwhile, the weekly US Jobless Claims data will entertain markets and offer fresh hints on the country’s labor market situation, impacting the value of the US Dollar and the Gold price action.
Gold price technical analysis: Daily chart
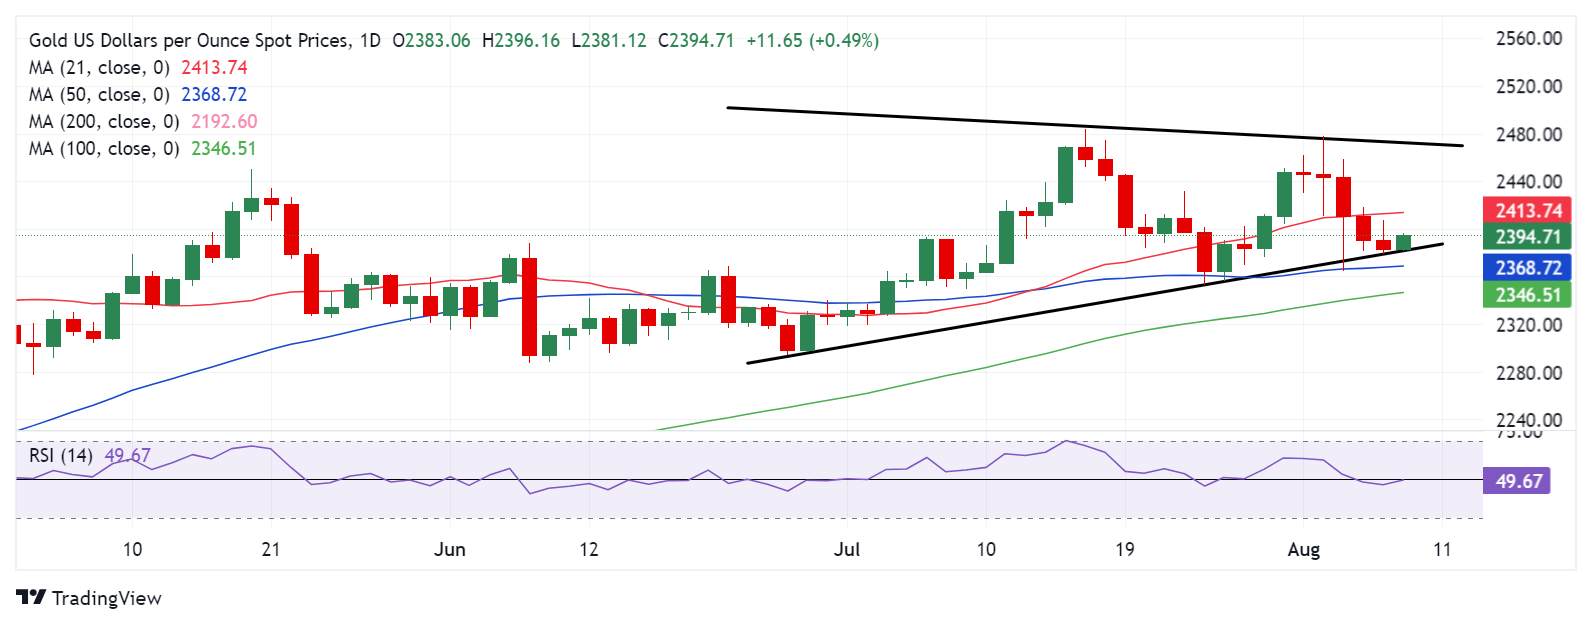
As observed on the daily chart, Gold price has been teasing the rising trendline support at $2,380, eyeing a downside break from a seven-week-old symmetrical triangle formation on a daily candlestick closing below that level.
The key leading indicator, the 14-day Relative Strength Index (RSI), is prodding the 50 level from downside, suggesting that there are risks for an extended Gold price rebound.
However, Gold buyers will need to recapture the 21-day Simple Moving Average (SMA) support-turned-resistance at $2,415 to negate the near-term bearish bias.
Further up, they will target the static resistance at $2,425 en-route the previous record high of $2,450.
If the triangle breakdown is confirmed, the immediate support would be seen at the 50-day SMA of $2,368, below which the $2,350 psychological level will get tested.
The 100-day SMA at $2,344 could act as a tough nut to crack for Gold sellers.
Economic Indicator
Initial Jobless Claims
The Initial Jobless Claims released by the US Department of Labor is a measure of the number of people filing first-time claims for state unemployment insurance. A larger-than-expected number indicates weakness in the US labor market, reflects negatively on the US economy, and is negative for the US Dollar (USD). On the other hand, a decreasing number should be taken as bullish for the USD.
Read more.Next release: Thu Aug 08, 2024 12:30
Frequency: Weekly
Consensus: 240K
Previous: 249K
Source: US Department of Labor
Every Thursday, the US Department of Labor publishes the number of previous week’s initial claims for unemployment benefits in the US. Since this reading could be highly volatile, investors may pay closer attention to the four-week average. A downtrend is seen as a sign of an improving labour market and could have a positive impact on the USD’s performance against its rivals and vice versa.
Premium
You have reached your limit of 3 free articles for this month.
Start your subscription and get access to all our original articles.
Author

Dhwani Mehta
FXStreet
Residing in Mumbai (India), Dhwani is a Senior Analyst and Manager of the Asian session at FXStreet. She has over 10 years of experience in analyzing and covering the global financial markets, with specialization in Forex and commodities markets.


