Gold Price Forecast: Focus on daily close, as XAU/USD breaches key support ahead of FOMC
- Gold price pressurizes weekly lows, as the US dollar holds the firmer ground.
- Strong US data, stimulus woes and G7 on China keep investors on the edge ahead of FOMC.
- Gold bears eye daily closing below the 2.5-month-long trendline support for further declines.

Gold price (XAU/USD) faced rejection at $1903 once again, which triggered a sharp drop to $1875 on Friday. Gold, however, recovered to $1877 on the close, still down for the second straight week. The main reason behind gold’s down move on Friday could be linked to the resurgent US dollar demand across the board, helped by a rebound in the US Treasury yields on stimulus optimism and strong Consumer Sentiment data. The University of Michigan (UoM) said its preliminary Consumer Sentiment Index increased to 86.4 in the first half of this month from a final reading of 82.9 in May. Amidst upbeat US economic data, markets turned hopeful about a likely hint on the Fed’s taper timing, lifting the dollar’s demand alongside the yields’.
Heading into the FOMC week, gold is extending the previous decline, now flirting with weekly lows near $1860, as the US dollar continues to hold the higher ground starting out a fresh week. Despite the Fed’s dismissal of rising inflation, markets believe that the FOMC outlook could offer fresh hints on monetary policy normalization. Meanwhile, mixed sentiment amid the renewed concerns over US President Joe Biden’s infrastructure plans and G7’s take on China’s covid origins and human rights issues continue to underpin the dollar’s mood. Meanwhile, holiday-thinned trading and light data docket could leave gold price in the hands of the dollar’s price action and risk trends.
Gold Price Chart - Technical outlook
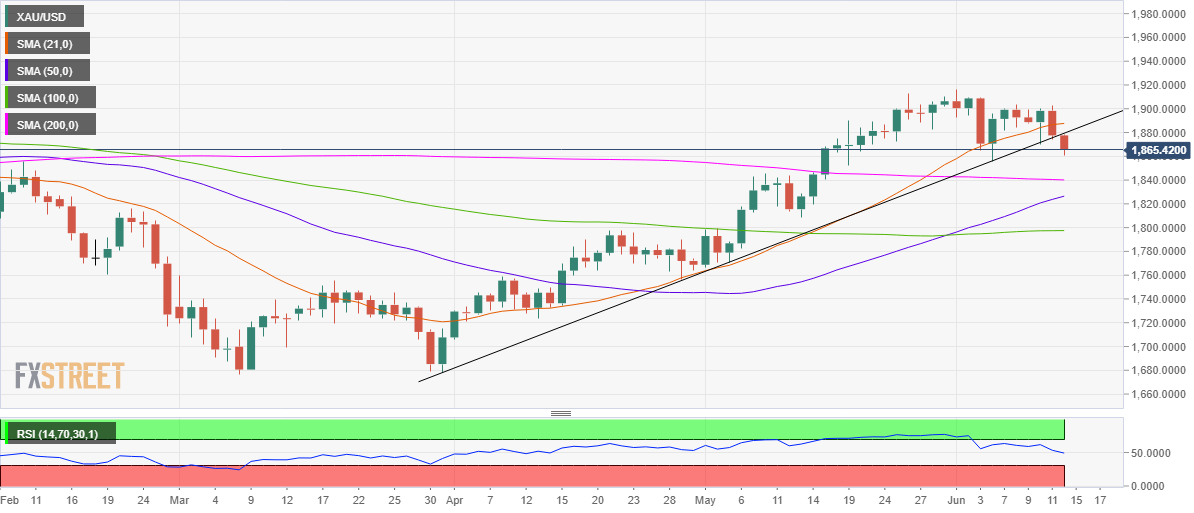
Gold: Daily chart
As observed on the daily chart, gold price has breached the two-and-a-half months-long rising trendline support at $1879.
A daily closing below the latter is required, in order to validate a bearish reversal from above the $1900 mark.
If the downswing extends, a test of the 200-Daily Moving Average at $1840 will be inevitable.
Ahead of that level, the psychological $1850 level could offer some respite to the bulls.
The Relative Strength Index (RSI) has pierced through the midline from above, backing the case for additional downside.
On the flip side, recapturing the abovementioned trendline support is critical for any recovery attempt towards the 21-DMA $1887. The level to beat for gold bulls is $1903.
Premium
You have reached your limit of 3 free articles for this month.
Start your subscription and get access to all our original articles.
Author

Dhwani Mehta
FXStreet
Residing in Mumbai (India), Dhwani is a Senior Analyst and Manager of the Asian session at FXStreet. She has over 10 years of experience in analyzing and covering the global financial markets, with specialization in Forex and commodities markets.


