Gold price analysis: XAU/USD has a weaker selling and starts bullish at 1690

Gold has continuously fallen down for a week, from $1760/oz to $1685/oz. Gold dropped because investors are encouraged by the speech of FED Chairman, Mr. Jerome Powell. In this speech, Powell asserted that inflation will increase when the economy recovers, but it is only temporary. He also warranted not to raise interest rates if inflation was not stable at 2% - 3% and the number of jobs created, is kept stable in the next quarter. The yield on US government bonds also increased after the speech on 4th March.
The yield curve of the United States increased strongly in February, showing a positive movement of the economy and optimis among investor. Therefore, cash flows from safe-haven assets to risky assets with higher profitability.
The DXY - US Dollar Index bumped up sharply yesterday, from 91.1 to 91.7. This is the strongest increase of a session in the past 3 months. However, the investor should note that this week there will be a decision on the $1900 billion stimulus package. Last week, the US House of Representatives has approved it and now we have to wait for a decision from the Senate as well as a signature from the new US President Joe Biden.
Trend analysis
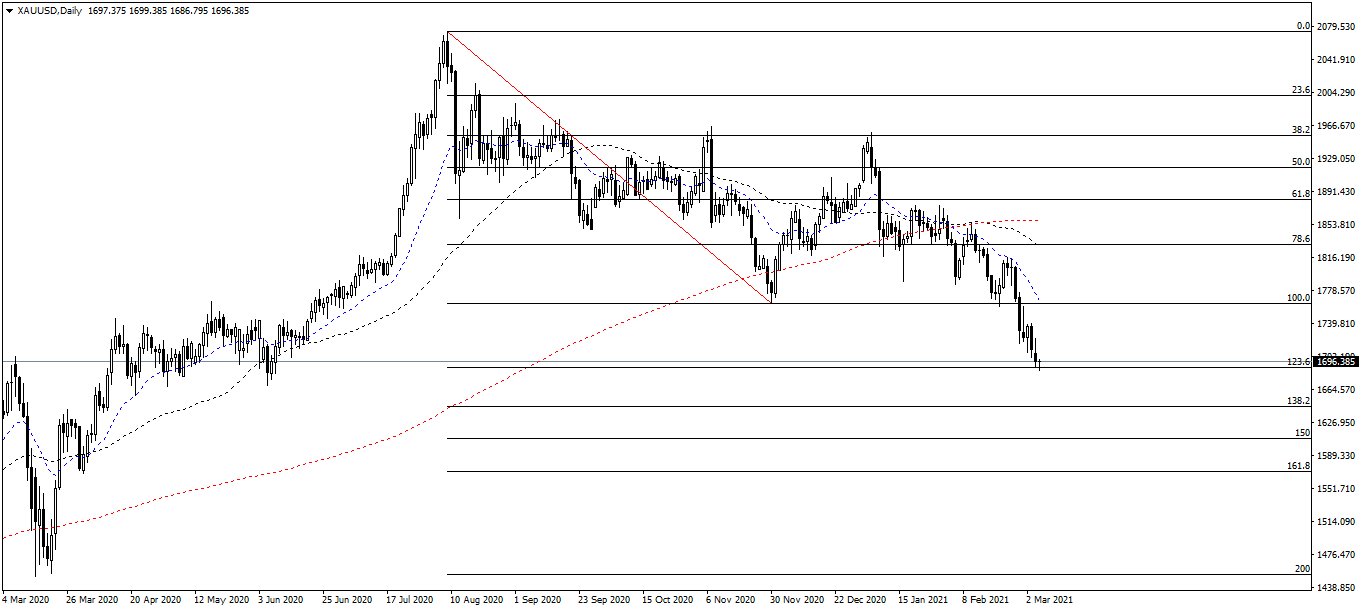
On the Daily chart, gold continue to be in a downtrend (formed from August 2020) and dived for 5 days. The downtrend continues to dominate Gold in the early days of March. Although the selling force is decreasing, the gold has not reached its maximum wavelength, which is about $1670/oz. Then preparing for an uptrend occurs next week. (see chart below)
Resistance/Support Analysis
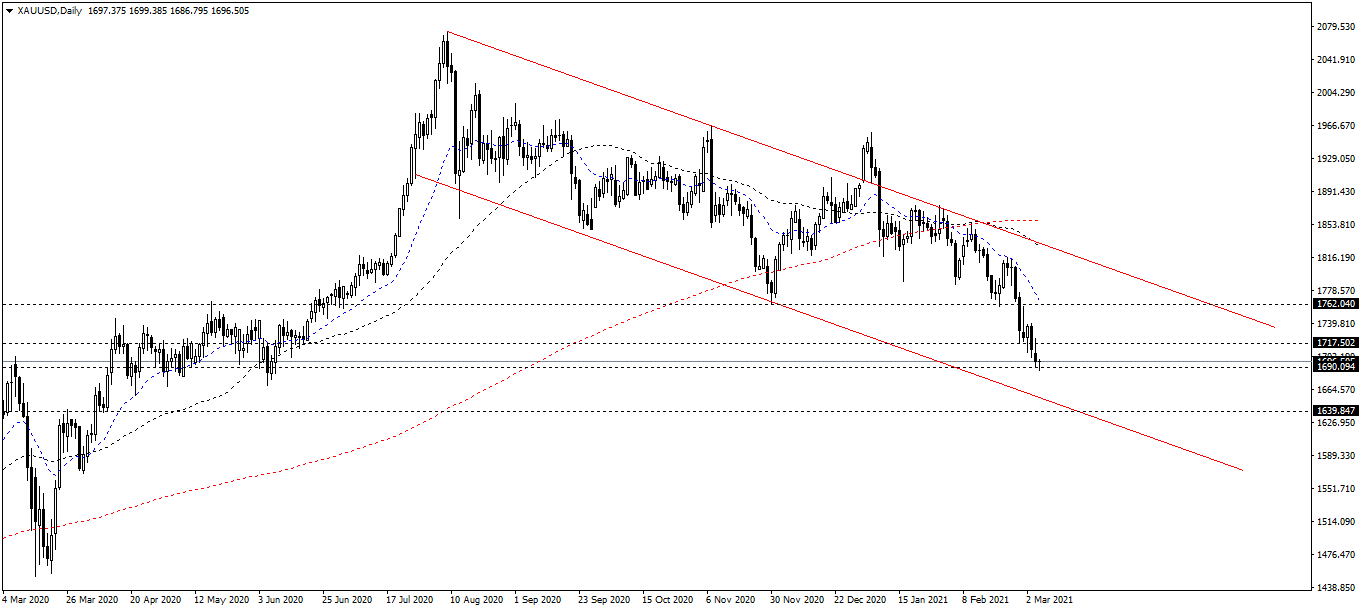
Gold has continuously broken strong support levels this week, right now, identifying support needs more observation. Two supports for this week are $1645/oz and $1670/oz. For the resistance, There is no strong enough resistance appearing on the chart at the moment, investors should be cautious with pending orders as the price can move sharply and pass at any time today, especially on weekend and the beginning of the week.
The resistances are $1715/oz, $1760/oz and $1780/ounce.
The supports are $1670/ounce and $1645/ounce.
Fibonacci analysis
The Fibonacci tool is measured on the daily chart at 1760/2070 level. In my previous analysis, gold touched the Fibonacci 123.6. This is a strong psychological resistance and a fairly reliable additional support. If gold breaks through this resistance and falls, the next target is the Fibonacci 138.2. This resembles to the price of $1670/oz, as I mentioned above.
Moving Average MA
On the Daily chart, the EMA20 has a third continuous week of strong drop and makes a far from the SMA200. This shows a message that in the mediumterm, the gold will continue falling. Meanwhile, the SMA50 also plummeted from the SMA200, showing that the long-term trend is still in favor of the bears, at least for this March.
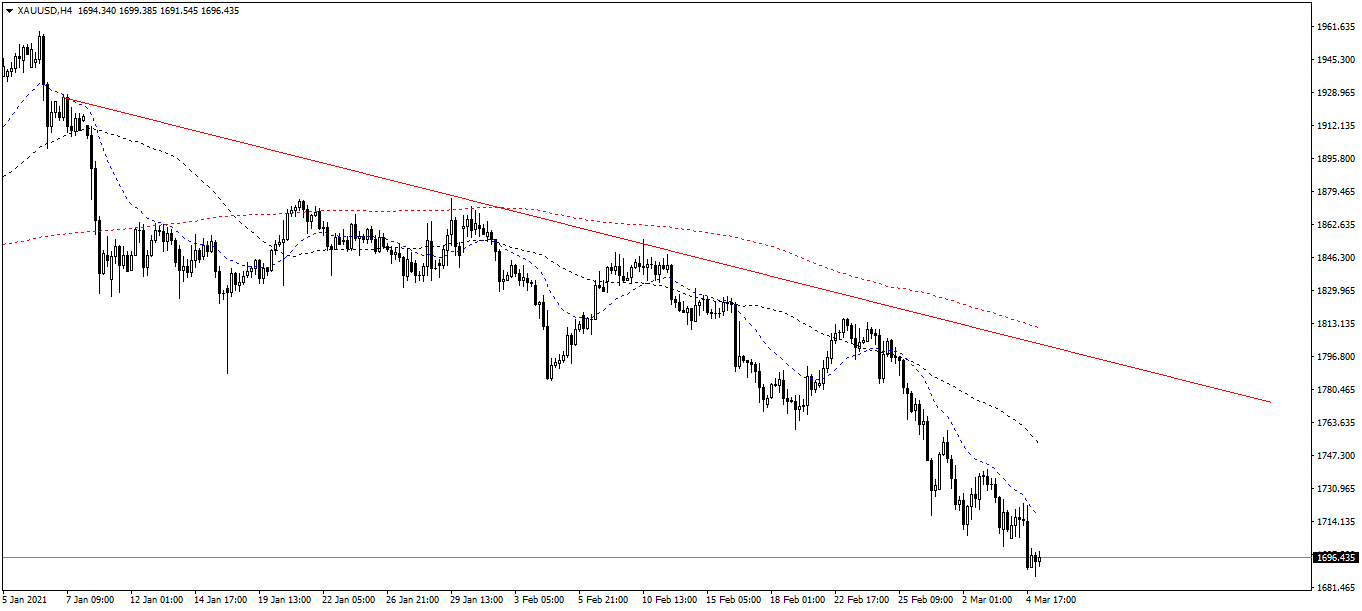
On the 4-hour chart, the two EMA20/SMA50 dropped and sloped off the SMA200. Similarly, this week is still down.
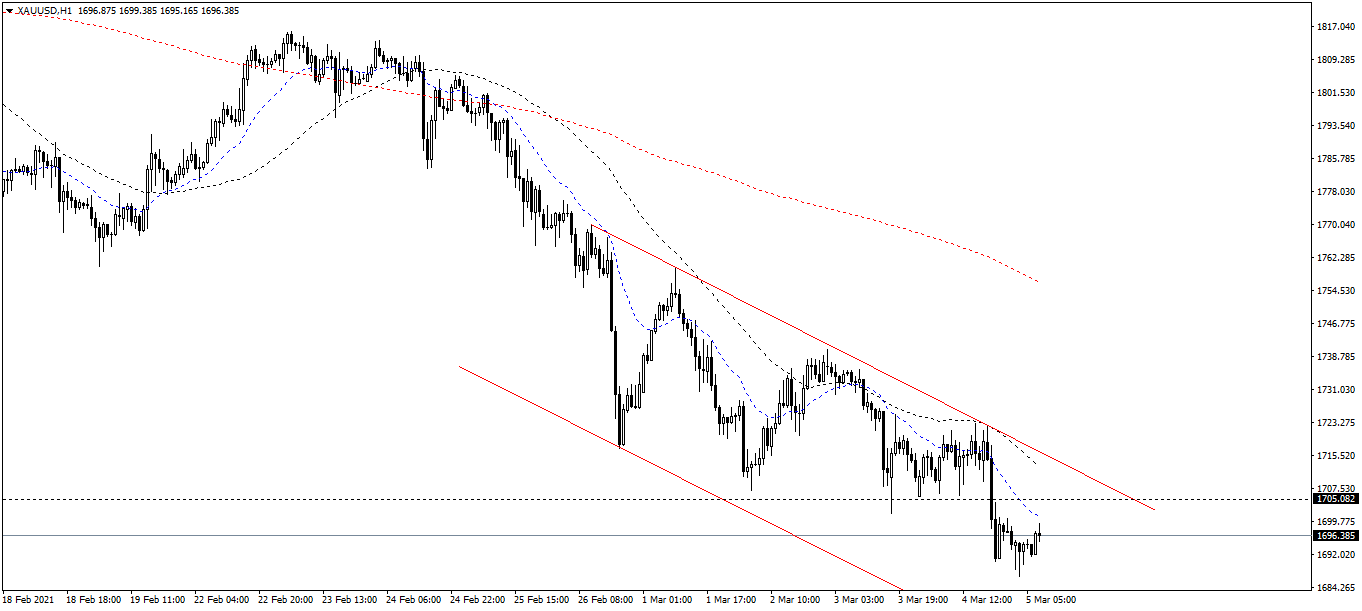
On the 1-Hour chart, the EMA20 is falling down and keeping away from the 2 SMA50/SMA200. Gold might drops $1670/oz this week.
Author

Thang Le
Independent Analyst
Thang Le is founder and owner of PSK - a financial community in Vietnam which at: Advising on strategic investment for individuals; Supporting the development of the investment community. He is Financial Analyst at Lion Group Hol


