|premium|

Gold, Chart of the Week: XAU/USD bearish bias forecast below $1,760

  • Gold is on a bearish path while below the 200 four-hour EMA.
  • The monthly 61.8% Golden Ratio is eyed for the weeks ahead. 

Gold has a compelling chart, especially from a top-down analysis that is presented below, offering a bearish bias in the main. We are in the last week of the month, and the markets are bracing for plenty of outcomes to critical market themes and events, which are sure to bring about volatility

Gold monthly chart

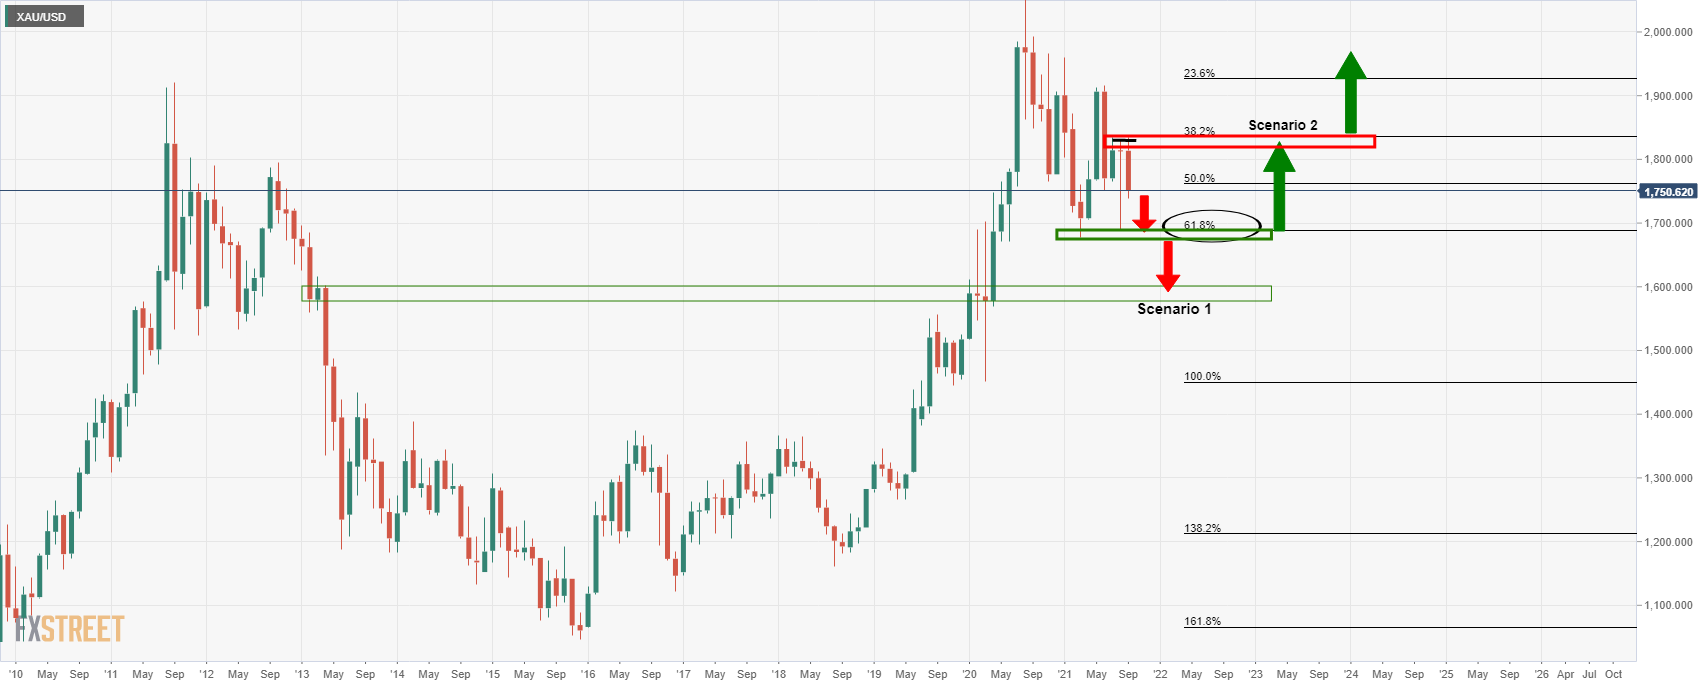
From a monthly perspective, the price is en route to the 61.8% Fibonacci level at $1,690 in the last week of the month. A bearish close for September makes for a bearish continuation bias for October.  In scenario 1, as illustrated on the chart above, the $1,600 level will be under pressure. In scenario 2, where the price is supported above the 61.8% ratio, the bulls will be seeking a break above $1,836 to put them back in control with $2,000 eyed once again. 

Gold weekly chart

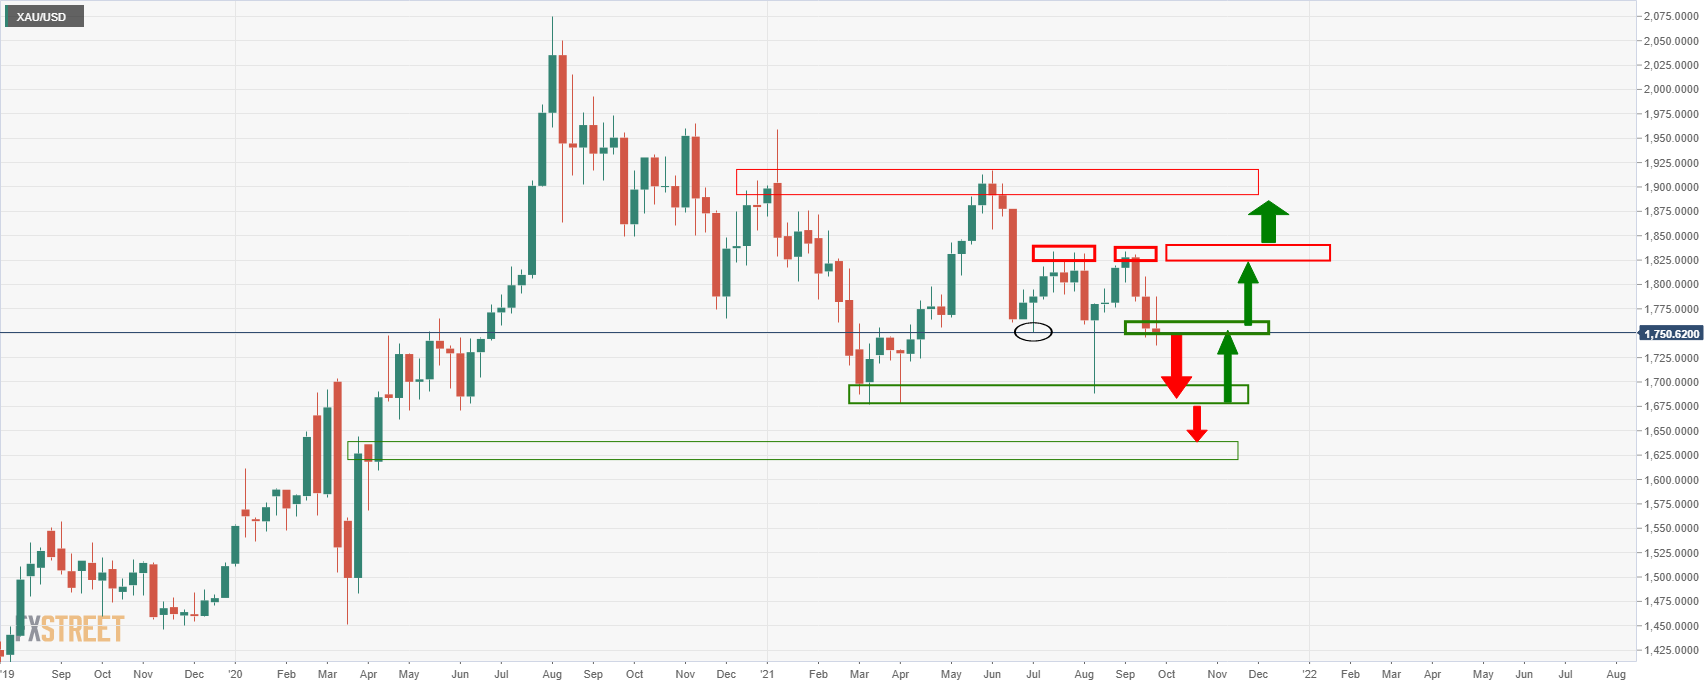
From a weekly outlook, the price is being supported near July lows in the $1,750s. Looking to the left, the price has made a series of lower lows until the summer and autumn's double top highs near $1,830. A break below $1,750 opens risk to the $1,680s initially. 

Gold daily chart

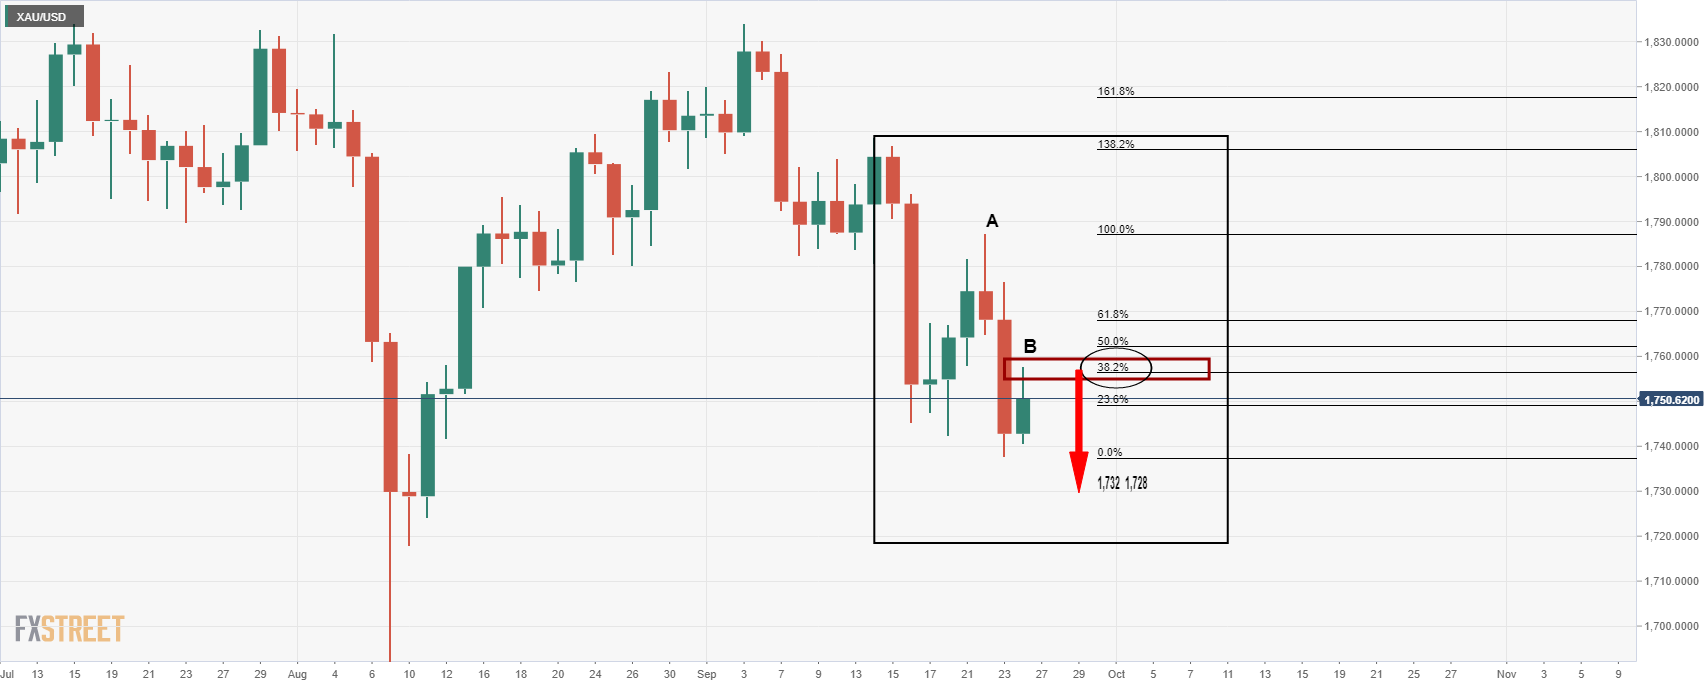
Looking at the daily chart, we are in the throes of a downside continuation and a test of the corrections as illustrated as A and B on the chart above. The targets are based on the Fibonacci retracements at $1,732 and $1,728 of the correction's range. 

Gold 4-hour chart

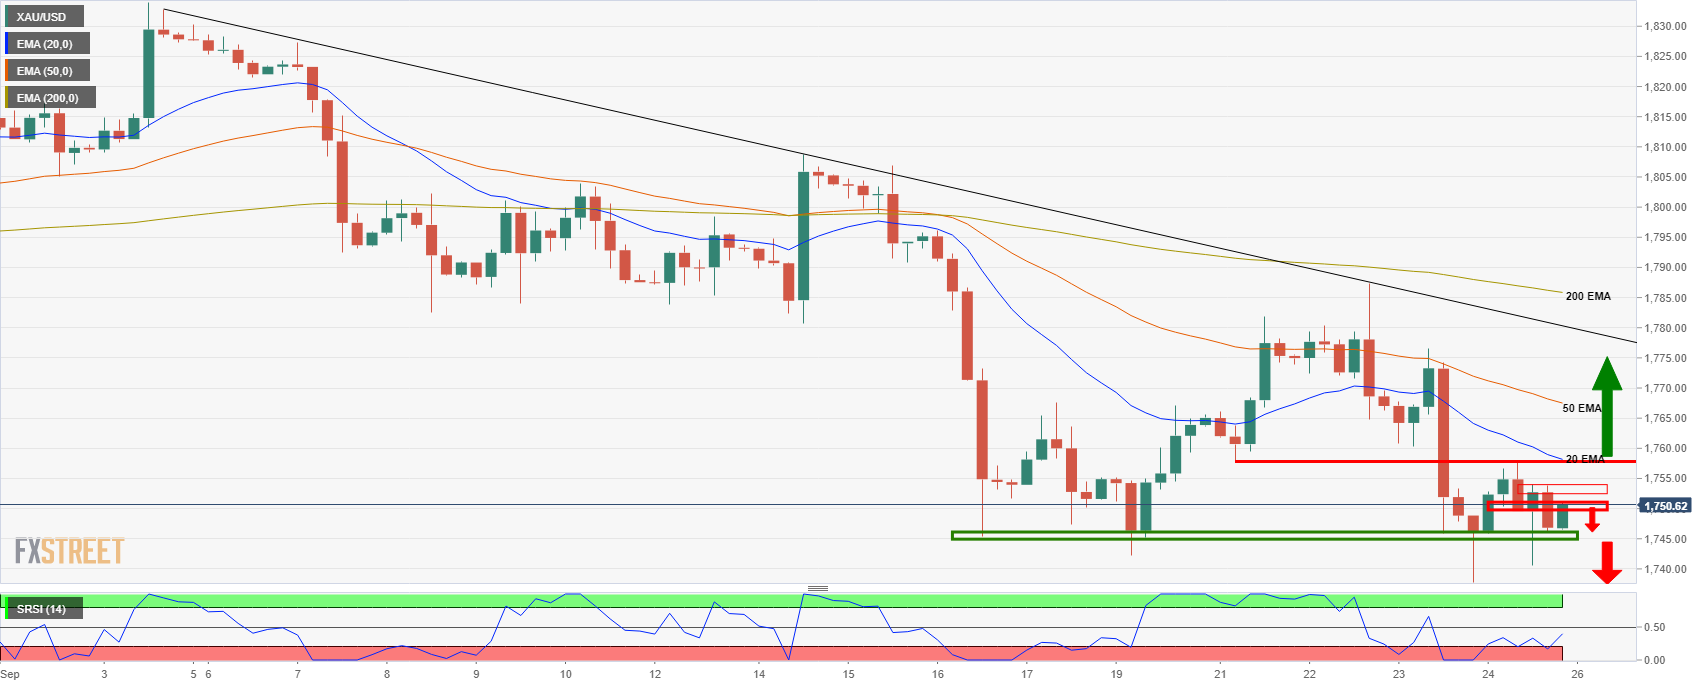
From a 4-hour study, the price is in a bearish trend while below the 200 exponential moving average (EMA) and the divergence of the 50 and 20 EMAs. The price is attempting to retest the 20 EMA, which might play out a little longer. However, so long as the price remains below $1,760 and the RSI below 50, then the bias is to the downside. 

Premium

You have reached your limit of 3 free articles for this month.

Start your subscription and get access to all our original articles.

Subscribe to PremiumSign In

Author

Ross J Burland

Ross J Burland, born in England, UK, is a sportsman at heart. He played Rugby and Judo for his county, Kent and the South East of England Rugby team.

More from Ross J Burland
Share:

Editor's Picks

AUD/USD looks weaker, focus is back to 0.7100

AUD/USD reverses Tuesday’s gains and retreats markedly toward four-day troughs in the low 0.7100s ahead of the opening bell in Asia. The firmer tone in the Greenback weighs on the risk complex amid unabated tensions on the US-Iran front, prompting the Aussie to shed part of recent gains and refocus on the downside. Moving forward, Australian trade balance results should entertain investors early on Thursday.

Japanese Yen bounces up from lows after Japan PM Takaichi’s intervention warnings

The Japanese Yen bounced up from five-week lows against the US Dollar, turning positive on the daily chart, as Japan’s Prime Minister Sanae Takaichi warned that Tokyo is ready to take action against Yen weakness. The USD/JPY pair has pulled back from the 160.00 level, considered a line in the sand for Japanese authorities, to hit session lows at 159.55.

Gold remains under bearish pressure, looks at $4,400

Gold keeps the offered stance well in place, retreating toward the $4,430 region per troy ounce, or four-day lows, on Wednesday. The yellow metal’s retracement comes in response to escalating tensions in the Middle East, which in turn continue to drive oil prices higher while reinforcing the idea of a tighter-for-longer Fed.


XRP eyes rebound despite muted ETF demand
Ripple (XRP) rebounds above $1.23 from support at $1.20 at the time of writing on Wednesday, as the broader cryptocurrency market pares losses triggered by escalating tensions in the Middle East. Appetite for risk assets remains generally low as the United States (US) and Iran exchange fire amid a fragile ceasefire and peace negotiations.
The upside-down math of debt
In 2010, Professors Carmen Reinhart and Kenneth Rogoff published a paper, Growth in a Time of Debt, which instantly went viral. The main thesis of the paper was that once a government's debt-to-GDP ratio crosses above 90%, a financial crisis and default are around the corner.
Recession on paper: What really moves the Canadian Loonie now?

Statistics Canada handed the headline writers a gift and the analysts a headache. Real GDP shrank 0.1% on an annualized basis in the first quarter, and with the fourth quarter of 2025 revised down to a 1.0% contraction, that is two negative quarters in a row, the textbook definition of a technical recession and Canada's first since the pandemic.