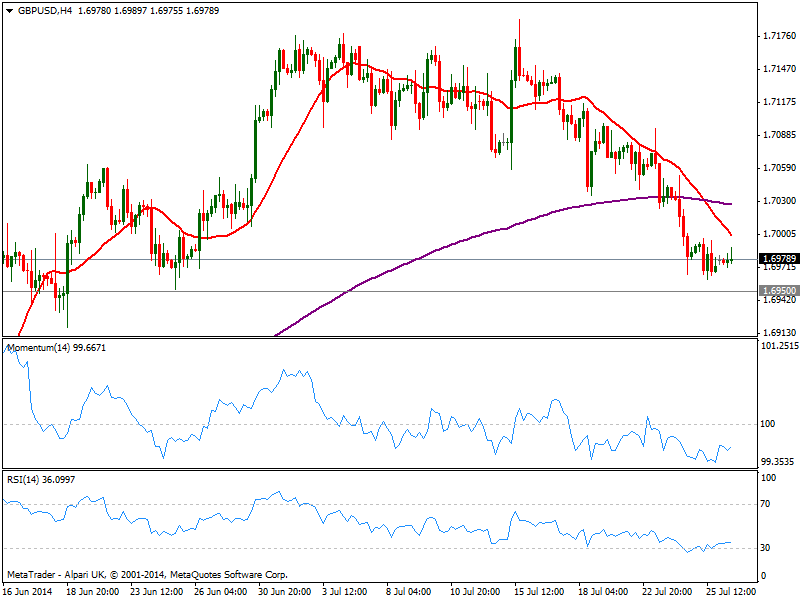
With no current directional strength, a price acceleration above mentioned 20 SMA should lead to a quick spike up to 1.7050, while an extension above this last should put the pair back in the bullish side, looking then for a test of 1.7095.
If price however extends its slide below 1.6950, stops will likely be triggered, accelerating the slide towards 1.6910 price zone.
View Live Chart for GBP/USD

Recommended Content
Editors’ Picks
EUR/USD keeps the bullish bias above 1.0700

EUR/USD rapidly set aside Friday’s decline and regained strong upside traction in response to the marked retracement in the Greenback following the still-unconfirmed FX intervention by the Japanese MoF.
USD/JPY looks stable around 156.50 as suspicious intervention lingers

USD/JPY remains well on the defensive in the mid-156.00s albeit off daily lows, as market participants continue to digest the still-unconfirmed FX intervention by the Japanese MoF earlier in the Asian session.
Gold advances for a third consecutive day

Gold fluctuates in a relatively tight channel above $2,330 on Monday. The benchmark 10-year US Treasury bond yield corrects lower and helps XAU/USD limit its losses ahead of this week's key Fed policy meeting.
Bitcoin price dips to $62K range despite growing international BTC validation via spot ETFs

Bitcoin (BTC) price closed down for four weeks in a row, based on the weekly chart, and could be on track for another red candle this week. The last time it did this was in the middle of the bear market when it fell by 42% within a span of nine weeks.
Japan intervention: Will it work?

Dear Japan Intervenes in the Yen for the first time since November 2022 Will it work? Have we seen a top in USDJPY? Let's go through the charts.