GBP/USD Forecast: Sellers could move aside if Pound Sterling rises above 1.3100
- GBP/USD holds steady above 1.3050 in the European session.
- The pair could gather recovery momentum if it clears 1.3100.
- The upbeat macroeconomic data releases from the UK support Pound Sterling early Friday.

GBP/USD clings to small daily gains early Friday after closing marginally lower on Thursday. The pair could extend its recovery if it manages to flip 1.3100 into support.
British Pound PRICE This week
The table below shows the percentage change of British Pound (GBP) against listed major currencies this week. British Pound was the weakest against the Swiss Franc.
| USD | EUR | GBP | JPY | CAD | AUD | NZD | CHF | |
|---|---|---|---|---|---|---|---|---|
| USD | 0.23% | 0.32% | 0.10% | 1.41% | 0.81% | 1.06% | -0.20% | |
| EUR | -0.23% | 0.15% | -0.10% | 1.20% | 0.56% | 0.82% | -0.46% | |
| GBP | -0.32% | -0.15% | -0.29% | 1.06% | 0.41% | 0.70% | -0.49% | |
| JPY | -0.10% | 0.10% | 0.29% | 1.30% | 0.69% | 0.90% | -0.29% | |
| CAD | -1.41% | -1.20% | -1.06% | -1.30% | -0.56% | -0.35% | -1.59% | |
| AUD | -0.81% | -0.56% | -0.41% | -0.69% | 0.56% | 0.30% | -0.98% | |
| NZD | -1.06% | -0.82% | -0.70% | -0.90% | 0.35% | -0.30% | -1.22% | |
| CHF | 0.20% | 0.46% | 0.49% | 0.29% | 1.59% | 0.98% | 1.22% |
The heat map shows percentage changes of major currencies against each other. The base currency is picked from the left column, while the quote currency is picked from the top row. For example, if you pick the British Pound from the left column and move along the horizontal line to the US Dollar, the percentage change displayed in the box will represent GBP (base)/USD (quote).
After coming in within a touching distance of 1.3000 in the early American session on Thursday, GBP/USD managed to erase a portion of its daily losses as the mixed macroeconomic data release from the US limited the US Dollar's (USD) strength.
The US Bureau of Labor Statistics reported on Thursday that inflation in the US, as measured by the change in the Consumer Price Index (CPI), softened to 2.4% on a yearly basis in September from 2.5% in August. Furthermore, the core CPI, which excludes volatile food and energy prices, rose 3.3% on a yearly basis, surpassing the market forecast of 3.2%, with the monthly core CPI increasing 0.3%. Other US data showed that the weekly Initial Jobless Claims rose to 258,000 in the week ending October 5 from 225,000 in the previous week, reviving concerns over a cooldown in the labor market.
Meanwhile, the UK's Office for National Statistics announced in the European morning on Friday that the Gross Domestic Product (GDP) expanded by 0.2% on a monthly basis in August, matching analysts' estimate. In the same period, Industrial Production and Manufacturing Production grew by 0.5% and 1.1%, respectively. These readings seem to be helping Pound Sterling stay resilient against its peers.
Ahead of the weekend, September producer inflation data will be featured in the US economic calendar. Investors see the monthly core Producer Price Index rising 0.2% in September, following the 0.3% increase recorded in August. In case the monthly core PPI comes in below the market expectation, GBP/USD could stretch higher in the American session.
GBP/USD Technical Analysis
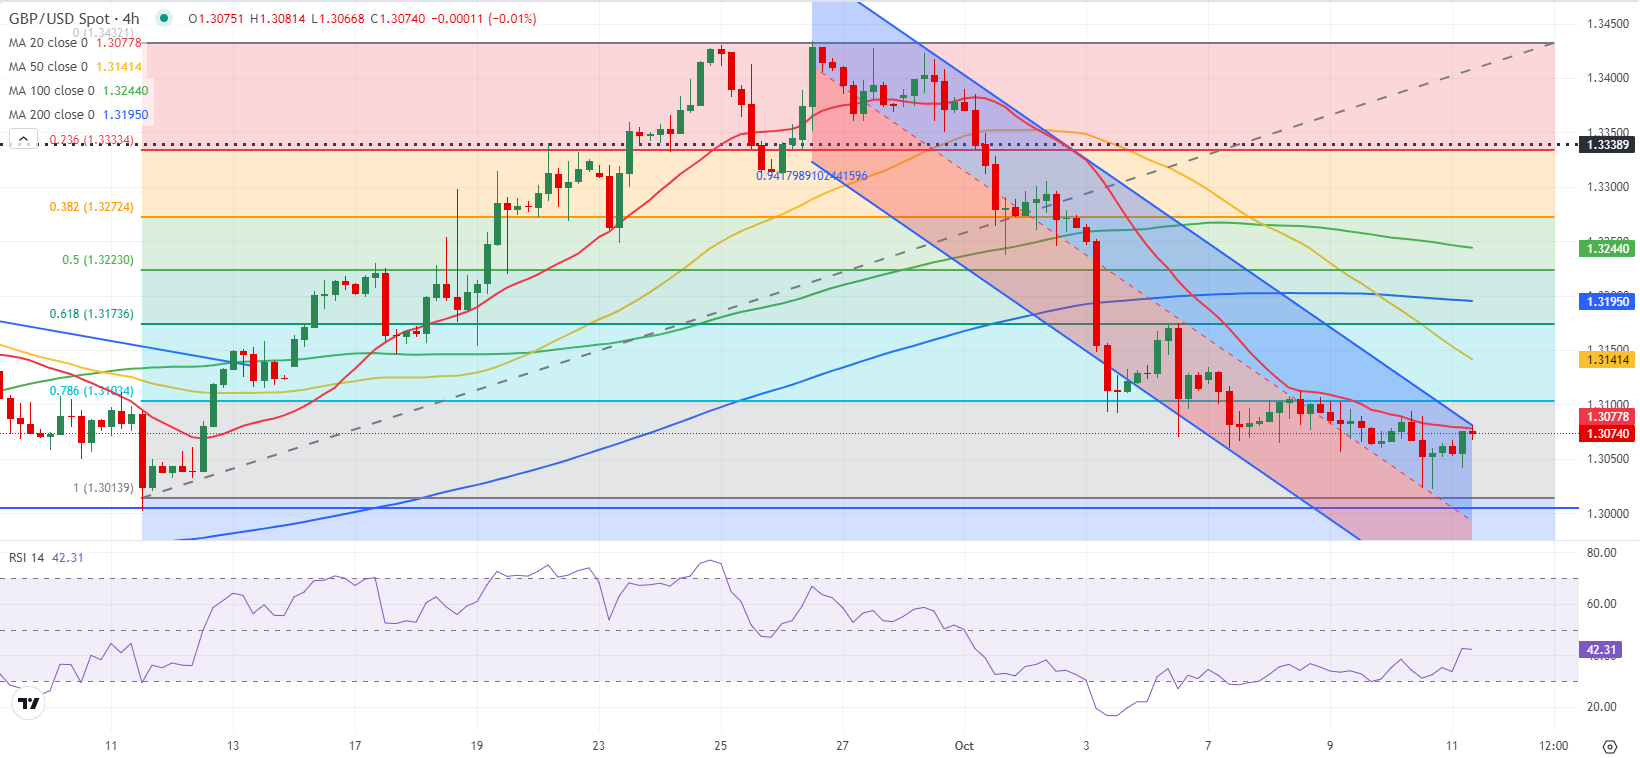
The Relative Strength Index (RSI) indicator on the 4-hour chart holds above 40 in the European session, suggesting that sellers remain reluctant to bet on an extended slide for now. On the upside, 1.3100 (Fibonacci 78.6% retracement level of the latest uptrend) aligns as key resistance level before 1.3170 (Fibonacci 61.8% retracement).
Looking south, interim support could be spotted at 1.3050 (static level) ahead of 1.3000 (round level, static level) and 1.2940 (static level).
Pound Sterling FAQs
The Pound Sterling (GBP) is the oldest currency in the world (886 AD) and the official currency of the United Kingdom. It is the fourth most traded unit for foreign exchange (FX) in the world, accounting for 12% of all transactions, averaging $630 billion a day, according to 2022 data. Its key trading pairs are GBP/USD, also known as ‘Cable’, which accounts for 11% of FX, GBP/JPY, or the ‘Dragon’ as it is known by traders (3%), and EUR/GBP (2%). The Pound Sterling is issued by the Bank of England (BoE).
The single most important factor influencing the value of the Pound Sterling is monetary policy decided by the Bank of England. The BoE bases its decisions on whether it has achieved its primary goal of “price stability” – a steady inflation rate of around 2%. Its primary tool for achieving this is the adjustment of interest rates. When inflation is too high, the BoE will try to rein it in by raising interest rates, making it more expensive for people and businesses to access credit. This is generally positive for GBP, as higher interest rates make the UK a more attractive place for global investors to park their money. When inflation falls too low it is a sign economic growth is slowing. In this scenario, the BoE will consider lowering interest rates to cheapen credit so businesses will borrow more to invest in growth-generating projects.
Data releases gauge the health of the economy and can impact the value of the Pound Sterling. Indicators such as GDP, Manufacturing and Services PMIs, and employment can all influence the direction of the GBP. A strong economy is good for Sterling. Not only does it attract more foreign investment but it may encourage the BoE to put up interest rates, which will directly strengthen GBP. Otherwise, if economic data is weak, the Pound Sterling is likely to fall.
Another significant data release for the Pound Sterling is the Trade Balance. This indicator measures the difference between what a country earns from its exports and what it spends on imports over a given period. If a country produces highly sought-after exports, its currency will benefit purely from the extra demand created from foreign buyers seeking to purchase these goods. Therefore, a positive net Trade Balance strengthens a currency and vice versa for a negative balance.
Author

Eren Sengezer
FXStreet
As an economist at heart, Eren Sengezer specializes in the assessment of the short-term and long-term impacts of macroeconomic data, central bank policies and political developments on financial assets.


