GBP/USD Forecast: Pound Sterling turns bearish as strong resistance holds
- GBP/USD edges lower after facing stiff resistance at 1.2700.
- The pair could face next support level at 1.2640.
- Technical picture highlights a bearish shift in the near-term outlook.

Following Monday's rebound, GBP/USD tested 1.2700 on Tuesday but failed to clear this level. The pair stays under modest bearish pressure on Wednesday and an extended slide could be seen if 1.2640 support is broken.
British Pound PRICE This week
The table below shows the percentage change of British Pound (GBP) against listed major currencies this week. British Pound was the weakest against the Australian Dollar.
| USD | EUR | GBP | JPY | CAD | AUD | NZD | CHF | |
|---|---|---|---|---|---|---|---|---|
| USD | 0.05% | -0.19% | 0.16% | -0.13% | -0.45% | 0.23% | 0.42% | |
| EUR | -0.05% | -0.23% | 0.17% | -0.13% | -0.47% | 0.23% | 0.46% | |
| GBP | 0.19% | 0.23% | 0.34% | 0.09% | -0.26% | 0.44% | 0.67% | |
| JPY | -0.16% | -0.17% | -0.34% | -0.28% | -0.57% | 0.17% | 0.27% | |
| CAD | 0.13% | 0.13% | -0.09% | 0.28% | -0.31% | 0.36% | 0.58% | |
| AUD | 0.45% | 0.47% | 0.26% | 0.57% | 0.31% | 0.70% | 0.93% | |
| NZD | -0.23% | -0.23% | -0.44% | -0.17% | -0.36% | -0.70% | 0.22% | |
| CHF | -0.42% | -0.46% | -0.67% | -0.27% | -0.58% | -0.93% | -0.22% |
The heat map shows percentage changes of major currencies against each other. The base currency is picked from the left column, while the quote currency is picked from the top row. For example, if you pick the British Pound from the left column and move along the horizontal line to the US Dollar, the percentage change displayed in the box will represent GBP (base)/USD (quote).
In the absence of high-tier data the cautious market stance helped the US Dollar (USD) stay resilient against rivals. Additionally, hawkish comments from Federal Reserve (Fed) officials further supported the USD. Fed Governor Michelle Bowman said on Tuesday that they are not yet at the point where it is appropriate to cut interest rates and added she is willing to raise the target rate at a future meeting if inflation progress stalls or reverses.
In the European session on Wednesday, US stock index futures trade marginally higher. Although a bullish opening in Wall Street could limit the USD's gains and help GBP/USD find a foot hold, the pair could have a hard time gathering bullish momentum, with investors awaiting next week's UK election before taking large positions.
The only data featured in the US economic docket will be New Home Sales for May. Following the 4.7% decline seen in April, another significant drop in this data could highlight the negative impact of the Fed's tight policy on the housing market and hurt the USD.
GBP/USD Technical Analysis
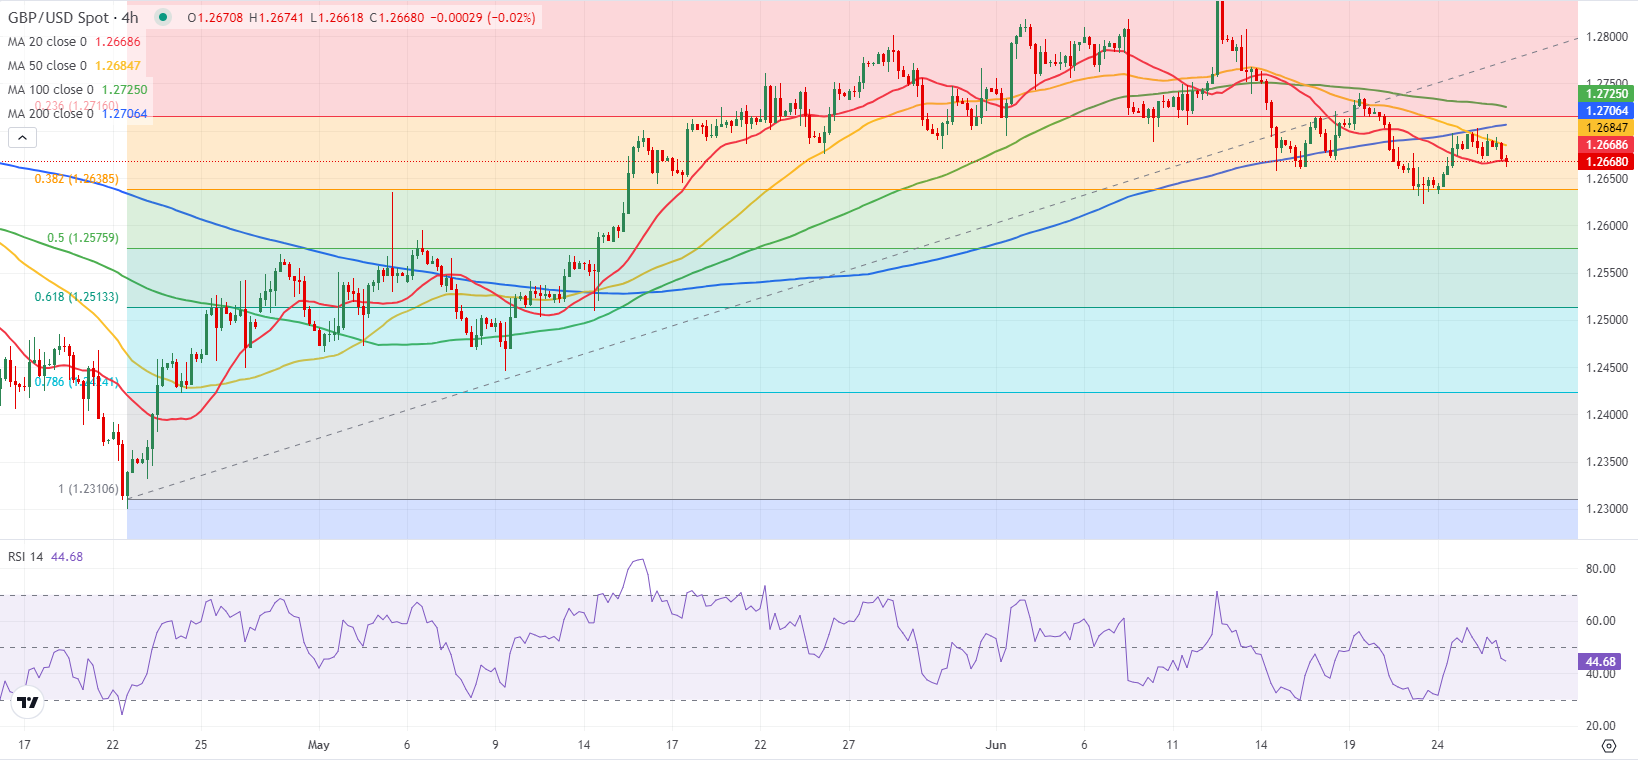
The Relative Strength Index (RSI) indicator on the 4-hour chart stays slightly below 50, reflecting the lack of buyer interest.
On the downside, the 100-day and the 50-day Simple Moving Averages (SMA) form strong support at 1.2640. This level is also reinforced by the Fibonacci 38.2% retracement of the latest uptrend. In case GBP/USD falls below this level and starts using it as resistance, 1.2600 (psychological level, static level) and 1.2580 (Fibonacci 50% retracement) could be seen as next bearish targets.
1.2700 (200-period SMA on the 4-hour chart) aligns as immediate resistance before 1.2730 (100-period SMA, Fibonacci 23.6% retracement) and 1.2800 (psychological level, static level).
Pound Sterling FAQs
The Pound Sterling (GBP) is the oldest currency in the world (886 AD) and the official currency of the United Kingdom. It is the fourth most traded unit for foreign exchange (FX) in the world, accounting for 12% of all transactions, averaging $630 billion a day, according to 2022 data. Its key trading pairs are GBP/USD, aka ‘Cable’, which accounts for 11% of FX, GBP/JPY, or the ‘Dragon’ as it is known by traders (3%), and EUR/GBP (2%). The Pound Sterling is issued by the Bank of England (BoE).
The single most important factor influencing the value of the Pound Sterling is monetary policy decided by the Bank of England. The BoE bases its decisions on whether it has achieved its primary goal of “price stability” – a steady inflation rate of around 2%. Its primary tool for achieving this is the adjustment of interest rates. When inflation is too high, the BoE will try to rein it in by raising interest rates, making it more expensive for people and businesses to access credit. This is generally positive for GBP, as higher interest rates make the UK a more attractive place for global investors to park their money. When inflation falls too low it is a sign economic growth is slowing. In this scenario, the BoE will consider lowering interest rates to cheapen credit so businesses will borrow more to invest in growth-generating projects.
Data releases gauge the health of the economy and can impact the value of the Pound Sterling. Indicators such as GDP, Manufacturing and Services PMIs, and employment can all influence the direction of the GBP. A strong economy is good for Sterling. Not only does it attract more foreign investment but it may encourage the BoE to put up interest rates, which will directly strengthen GBP. Otherwise, if economic data is weak, the Pound Sterling is likely to fall.
Another significant data release for the Pound Sterling is the Trade Balance. This indicator measures the difference between what a country earns from its exports and what it spends on imports over a given period. If a country produces highly sought-after exports, its currency will benefit purely from the extra demand created from foreign buyers seeking to purchase these goods. Therefore, a positive net Trade Balance strengthens a currency and vice versa for a negative balance.
Author

Eren Sengezer
FXStreet
As an economist at heart, Eren Sengezer specializes in the assessment of the short-term and long-term impacts of macroeconomic data, central bank policies and political developments on financial assets.


