S&P 500 (cash) near term outlook:
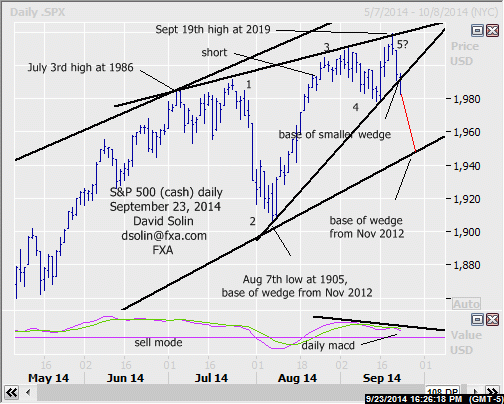
No change as the market is seen in process of an important topping (potentially a major topping, see longer term below), recently turning down from a slight/temporary new high on Sept 19th high at 2019. Note that lots of negatives are evident and include the slowing upside momentum over the last few months, deterioration and no confirmation from the technicals (see bearish divergence/sell mode on the daily macd at bottom of daily chart below), and potential rising wedge/reversal pattern (often resolve sharply) that has been forming since July. Additionally, cycles point lower over the next few months (previously discussed Bradley model tumbles into late Nov), and the widely reported "Death Cross"/under performance in the Russell 2000 (50 day moving average breaks below 200 day ma, see 3rd chart below) add to this bearish potential. A final note, looks the like the market today took out the base of the that rising wedge in the s&p 500 (see daily chart below), and raises potential for a further downside acceleration over the next few days/weeks. Nearby support is seen at 1975/78 (Sept 15th low, 38% retracement from the Aug low at 1905), and the critical bullish trendline/base of an even larger rising wedge from Nov 2012 (currently at 1940/45). Resistance is now at the broken base of the wedge (currently at 1992/95). Bottom line: given today's break of the multi-month rising wedge, there is potential for a downside acceleration over the next few days/weeks.
Near term strategy/position:
Reached the sell target from the Aug 15th email at 1990 on Aug 21st and for now would continue to stop on a close 5 pts above that ceiling of the wedge (to allow for more topping nearby). However, will want to get more aggressive with trailing stops on further downside ahead.
Long term outlook:
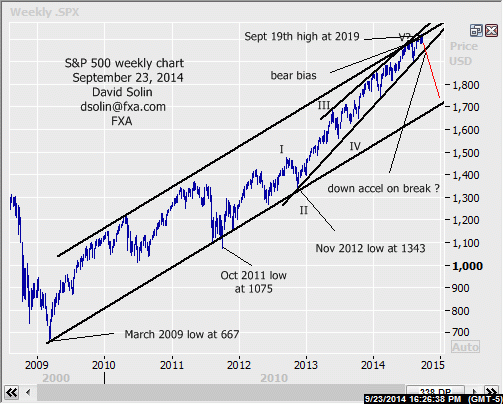
As discussed above, lots of negatives are evident but a number of more major, long term negatives are also evident and raises potential for a more significant top (9-12 months or more). Note that the market is very overbought after the huge surge from the March 2009 low at 667, the highs over the last few months were capped by the ceiling of the huge bullish channel since that low, and appear to be within the final upleg in the rally from at least the Oct 2011 low at 1075 (wave V). Also interesting that the market is forming a larger rising wedge since Nov 2012. As discussed above, these are seen as reversal patterns that often resolve sharply, so this "wedge within a larger wedge" raises some scope for a huge tumble ahead. Key support is seen at that bullish trendline from Nov 2012/base of the larger wedge (could seen a bigger picture, down acceleration tumble on a break below). Bottom line: this bearish wedge (since July) within the larger wedge since Nov 2012 raises scope for a major, potentially sharp decline over the next 9-12 months (or more).
Long term strategy/position:
Also switched the longer term bias to the bearish side on Aug 21st at 1990.
Current:
Nearer term: reached the sell target from the Aug 15th email at 1990 on Aug 21st.
Last: short Apr 10 at 1861, stopped May 27th at 1912.
Longer term: bearish bias Aug 21st at 1990, some potential of a more major top (9-12 months).
Recommended Content
Editors’ Picks
USD/JPY crashes toward 156.00, Japanese intervention in play?

Having briefly recaptured 160.00, USD/JPY came under intense selling and sank toward 156.00 on what seems like a Japanese FX intervention underway. The Yen tumbled in early trades amid news that Japan's PM lost 3 key seats in the by-election. Holiday-thinned trading exaggerates the USD/JPY price action.
AUD/USD rallies toward 0.6600 on risk flows, hawkish RBA expectations

AUD/USD extends gains toward 0.6600 in the Asian session on Monday. The Aussie pair is underpinned by increased bets of an RBA rate hike at its May policy meeting after the previous week's hot Australian CPI data. Risk flows also power the pair's upside.
Gold stays weak below $2,350 amid risk-on mood, firmer USD

Gold price trades on a softer note below $2,350 early Monday. The recent US economic data showed that US inflationary pressures stayed firm, supporting the US Dollar at the expense of Gold price. The upbeat mood also adds to the weight on the bright metal.
Ethereum fees drops to lowest level since October, ETH sustains above $3,200

Ethereum’s high transaction fees has been a sticky issue for the blockchain in the past. This led to Layer 2 chains and scaling solutions developing alternatives for users looking to transact at a lower cost.
Week ahead: Hawkish risk as Fed and NFP on tap, Eurozone data eyed too

Fed meets on Wednesday as US inflation stays elevated. Will Friday’s jobs report bring relief or more angst for the markets? Eurozone flash GDP and CPI numbers in focus for the Euro.


