$/yen near term outlook:
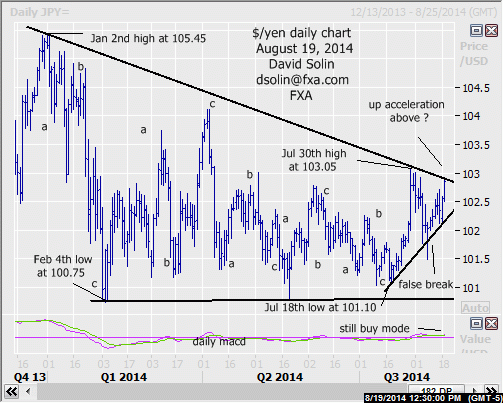
Big picture view remains unchanged, as the market is seen within an extended period of consolidating since the Jan high at 105.45. Note that the series of "sloppy", 3 wave moves in both directions (a-b-c's, see daily chart below) argues a large correction, with eventual gains back to the 105.45 high and even above after (see longer term below). Shorter term, the market has indeed continued higher, still supported by that bullish trendline from July 18th (currently at 102.05/15) and approaching resistance in the 102.90/10 area (bear trendline from Jan, Jul 30th high). Seen as a potentially important resistance area, as a break above could trigger a further, upside acceleration, and increase the likelihood that this multi-month correction is complete. At this point, the confidence of such a surge directly ahead is not extremely high with the seasonal chart for the yen that is sharply higher from now through Oct (see 3rd chart below, tumbles for $/yen) somewhat lowering the likelihood, but the potential is there. Resistance above there is seen at 104.00/15 (April high). Key support remains at that bullish trendline from July 18th, as a break/close below would argue further ranging/basing back toward the important 100.65/85 support area (base of the large correction since Jan). Bottom line : still supported by key bull trendline from July, above 103.10 area could trigger upside acceleration.
Strategy/position:
Still long from the Aug 5th buy at 102.75 and would continue to stop on a close 15 ticks below that bullish trendline from July 18th.
Long term outlook:
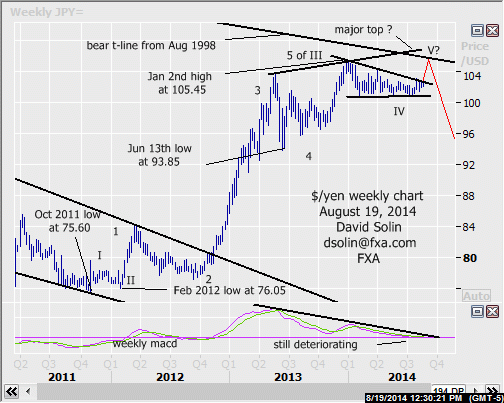
As discussed above, still view trade from the Jan high at 105.45 as a large correction (wave IV in the rally from the Oct 2011 low at 75.60), and with eventual new highs after. However, such a move higher may be limited and versus the start of a more major, new upleg (see in red on weekly chart/2nd chart below). Note that such a move above 105.45 would be seen as the final leg in that large rally from Oct 2011 (wave V), long term technicals continue to deteriorate (see weekly macd at bottom of 2nd chart below) and the market remains overbought in the big picture after the last few years of sharp gains. A final note, a clear break below that key 100.65/85 (base of the consolidation since Jan), would argue that a more major top is already in place. Bottom line : gains above the Jan high at 105.45 still favored, but magnitude of such upside a question.
Strategy/position:
With eventual gains back to the Jan 105.45 still favored, would stay with the longer term bullish bias that was put in place on Aug 5th at 102.60.
Current:
Nearer term : long Aug 5th at 102.60, some chance for up acceleration on break above 103 area.
Last : long Jun 2 above t-line from Apr (101.90, closed 102.35), stopped Jun 11th at 102.05.
Longer term: bull bias Aug 5th at 102.60 for eventual 105.45, risk for further wide consolidating first.
Last : bearish bias May 19th at 101.20 to neutral Jun 4th at 102.65.
Recommended Content
Editors’ Picks
AUD/USD refocuses on 0.6700 and beyond

The unabated selling pressure in the Greenback propped up broad-based extra gains in the risk complex, sending AUD/USD to the boundaries of 0.6700 the figure, up for the third session in a row.
EUR/USD: Next on the upside comes 1.0980

EUR/USD maintained its constructive bias well in place at the beginning of the new trading week and flirted with the key 1.0900 barrier on the back of the generalized offered stance in the US Dollar.
Gold holding within familiar levels around $2,350

Gold extends its recovery and trades above $2,340 in the American session. The benchmark 10-year US Treasury bond yield loses nearly 2% on the day below 4.5% following the disappointing PMI data, providing a boost to XAU/USD.
Ethereum remains in horizontal trend, net outflows across crypto exchanges top $3 billion

Ethereum (ETH) sustained a week-long horizontal trend on Monday following massive exchange outflows in the past seven days, which coincided with increased ETH fund inflows.
How the Federal Reserve drives the boom-bust cycle

The Federal Reserve was sold as a way to "provide the nation with a safer, more flexible, and more stable monetary and financial system." That's not what the central bank does.

