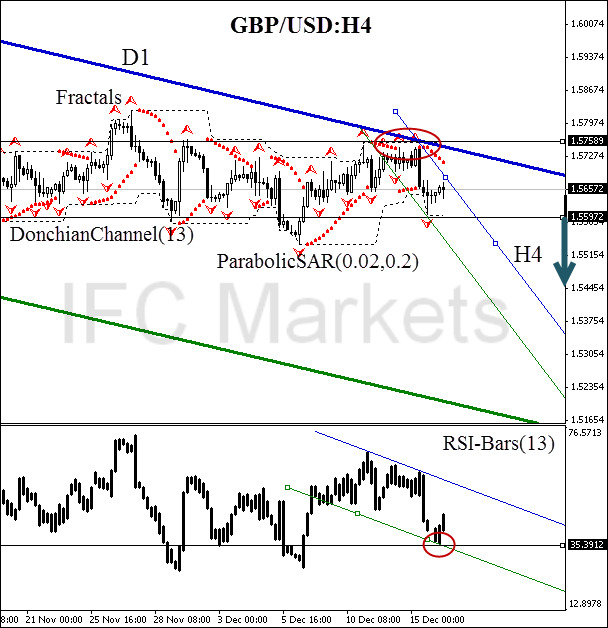
Here we consider GBP/USD currency pair on the H4 chart. As oil prices keep falling, we observe the US dollar strengthening against the most liquid currencies. The British pound is not an exception. The price is moving within the limits of D1 and H4 downtrend channel: bearish trend is observed for all the timeframe scales. The trend is confirmed by ParabolicSAR values, which cross the trendline and fractal resistance level. Donchian Channel is also indicating the bearish bias. There is no contradiction on the part of the RSI-Bars oscillator. At the moment, it approached the local support level at 35.3912%. We expect that this level would be crossed when the price breaks the support level at 1.55972. This mark can be used for opening a pending sell order. Stop Loss is better to be placed at the Bill Williams resistance fractal 1.57589, which is strengthened by Parabolic historical values and the bearish pattern “double top” (marked in red ellipse on the chart). We can see that the pound has been drifting sideways for almost a month. It increases the probability of volatility surge and the consolidation completion.
After position opening, Stop Loss is to be moved after the Parabolic values, near the next fractal high. Updating is enough to be done every day after a new Bill Williams fractal formation (5 candlesticks). Thus, we are changing the probable profit/loss ratio to the breakeven point.
- Position Sell
- Sell stop below 1.55972
- Stop loss above 1.57589
Recommended Content
Editors’ Picks
AUD/USD retargets the 0.6600 barrier and above

AUD/USD extended its positive streak for the sixth session in a row at the beginning of the week, managing to retest the transitory 100-day SMA near 0.6580 on the back of the solid performance of the commodity complex.
EUR/USD keeps the bullish bias above 1.0700

EUR/USD rapidly set aside Friday’s decline and regained strong upside traction in response to the marked retracement in the Greenback following the still-unconfirmed FX intervention by the Japanese MoF.
Gold advances for a third consecutive day

Gold fluctuates in a relatively tight channel above $2,330 on Monday. The benchmark 10-year US Treasury bond yield corrects lower and helps XAU/USD limit its losses ahead of this week's key Fed policy meeting.
Bitcoin price dips to $62K range despite growing international BTC validation via spot ETFs

Bitcoin (BTC) price closed down for four weeks in a row, based on the weekly chart, and could be on track for another red candle this week. The last time it did this was in the middle of the bear market when it fell by 42% within a span of nine weeks.
Japan intervention: Will it work?

Dear Japan Intervenes in the Yen for the first time since November 2022 Will it work? Have we seen a top in USDJPY? Let's go through the charts.