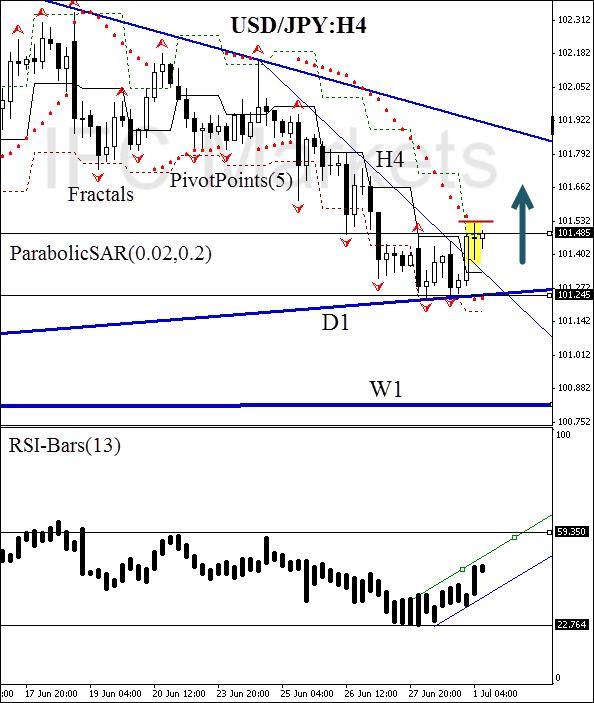
Good afternoon, dear traders. Here we consider the USD/JPY currency pair on the H4 chart. As we can see, the price broke the resistance of the H4 trend channel. This happened simultaneously with the bullish ParabolicSAR reversal and upward PivotPoints signal line crossing. There is no contradiction on the part of the RSI-Bars oscillator: the indicator confirms the upward movement.
Pending Buy Order is to be preliminary placed above the balance candle peak at 101.532. This key level is confirmed by theParabolicSAR historical values and the first PivotPoints resistance. Stop Loss is to be placed below the previous Bill Williams fractal at 101.245. This support is strengthened by the historical values of both trend indicators. Opening a position, it is recommended to move the Stop Loss after the parabolic values every 4 hours after the order execution. Thus, we can optimize the return/risk ratio in our favor in the process of changing market conditions. If you decide to take a break from the market, the automatic Trailing Stop can be placed, taking the distance between the two previous Parabolic indicator values into account.
Pending Buy Order is to be preliminary placed above the balance candle peak at 101.532. This key level is confirmed by theParabolicSAR historical values and the first PivotPoints resistance. Stop Loss is to be placed below the previous Bill Williams fractal at 101.245. This support is strengthened by the historical values of both trend indicators. Opening a position, it is recommended to move the Stop Loss after the parabolic values every 4 hours after the order execution. Thus, we can optimize the return/risk ratio in our favor in the process of changing market conditions. If you decide to take a break from the market, the automatic Trailing Stop can be placed, taking the distance between the two previous Parabolic indicator values into account.
Recommended Content
Editors’ Picks
EUR/USD clings to gains above 1.0750 after US data

EUR/USD manages to hold in positive territory above 1.0750 despite retreating from the fresh multi-week high it set above 1.0800 earlier in the day. The US Dollar struggles to find demand following the weaker-than-expected NFP data.
GBP/USD declines below 1.2550 following NFP-inspired upsurge

GBP/USD struggles to preserve its bullish momentum and trades below 1.2550 in the American session. Earlier in the day, the disappointing April jobs report from the US triggered a USD selloff and allowed the pair to reach multi-week highs above 1.2600.
Gold struggles to hold above $2,300 despite falling US yields

Gold stays on the back foot below $2,300 in the American session on Friday. The benchmark 10-year US Treasury bond yield stays in negative territory below 4.6% after weak US data but the improving risk mood doesn't allow XAU/USD to gain traction.
Bitcoin Weekly Forecast: Should you buy BTC here? Premium

Bitcoin (BTC) price shows signs of a potential reversal but lacks confirmation, which has divided the investor community into two – those who are buying the dips and those who are expecting a further correction.
Week ahead – BoE and RBA decisions headline a calm week

Bank of England meets on Thursday, unlikely to signal rate cuts. Reserve Bank of Australia could maintain a higher-for-longer stance. Elsewhere, Bank of Japan releases summary of opinions.