Forex majors continue to reflect more risk positive positioning

Market Overview
As positive newsflow on the trade dispute continues to drip feed the improvement in market sentiment, traders continue to move away from their safe haven positioning. Nowhere is this more evident than in the bond markets where Treasury yields continue to climb higher. The US 10 year yield is now up over 1.70% (at four week highs), having added around 30bps in September. The positive sentiment is reflected in forex markets which continue to shun the Japanese yen in favour of more riskier positioning such as the Australian dollar and sterling, the latter helped by reduced expectation of a “hard” Brexit. We are seeing multi-week highs on equities (S&P 500 and DAX), whilst oil has also broken out and traders continue to take profits on their long gold positions. The one major market which is still in limbo is EUR/USD, which has traders on the side-lines ahead of a crucial ECB monetary policy decision tomorrow. For weeks, the market has been preparing for a package of easing measures. With uncertainty over how substantial these measures could be and questions over how much ammunition the ECB has in reserve, this is leaving indecisive traders unwilling to take a view ahead of Thursday’s meeting.
Wall Street closed with mild gains once more with the S&P 500 +0.1% at 2979, whilst US futures are also just a tick or two higher. Asian markets come with a mixed outlook as the Nikkei +1.0% whilst the Shanghai Composite has fallen by -0.4%. In Europe, the outlook is resuming its positive trend, the FTSE futures +0.4% and DAX futures +0.4%, although with sterling higher, this could drag on UK equities as the session goes on. In forex trading, there is a continuation of the risk positive outlook, with JPY underperformance whilst AUD is strong. GBP also continues to climb. In commodities there is a bounce back on gold after four days of decline, whilst the oil bulls have regained some control again today.
It is a quiet day for the economic calendar, but US factory gate inflation will give another gauge of broader inflation trends. US PPI is at 1330BST which is expected to show headline PPI remaining at +1.7% in August (+1.7% in July) whilst core PPI is expected to tick slightly higher to +2.2% (from +2.1% in July). The EIA weekly oil inventories are at 1530BST which are expected to show another crude stocks drawdown of -2.6m barrels, with distillates building by +1.6m barrels and gasoline stocks to drawdown by -0.9m barrels.
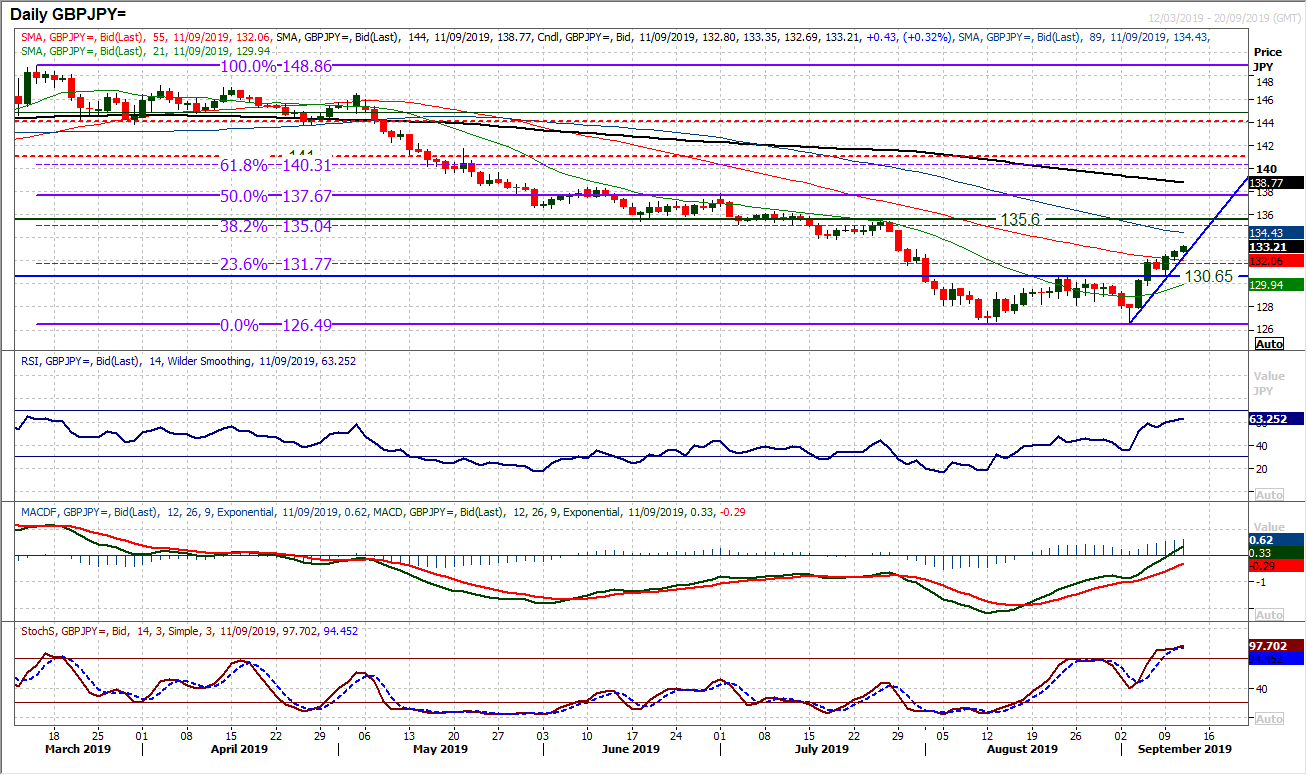
Chart of the Day – GBP/JPY
The reduced expectation a hard Brexit and broad risk appetite improvement has pulled Sterling/Yen higher in the past week. Technically this has had significant implications on GBP/JPY as a breakout has broken above 130.65 to drive a change in trend. Instead of consistent lower highs and lower lows of the summer months, the breakout has completed a base pattern to form higher lows and higher highs. The base of 126.50/130.65 implies around 400 pips of recovery to 134.65 which brings the resistance band 133.80/135.00 into range. It is interesting to see the pullback to the neckline bouncing off 130.80 on Monday where it then built support of a higher low. The strength of momentum is pulling through with RSI into the 60s, and MACD lines accelerating towards neutral. Both indicators along with the Stochastics are at six month highs. Weakness is a chance to buy as the move through the 23.6% Fibonacci retracement of 148.85/126.50 (at 131.75) has now opened the 38.2% Fib level around 135.00. There is a strong support band 130.65/131.75 now.
EUR/USD
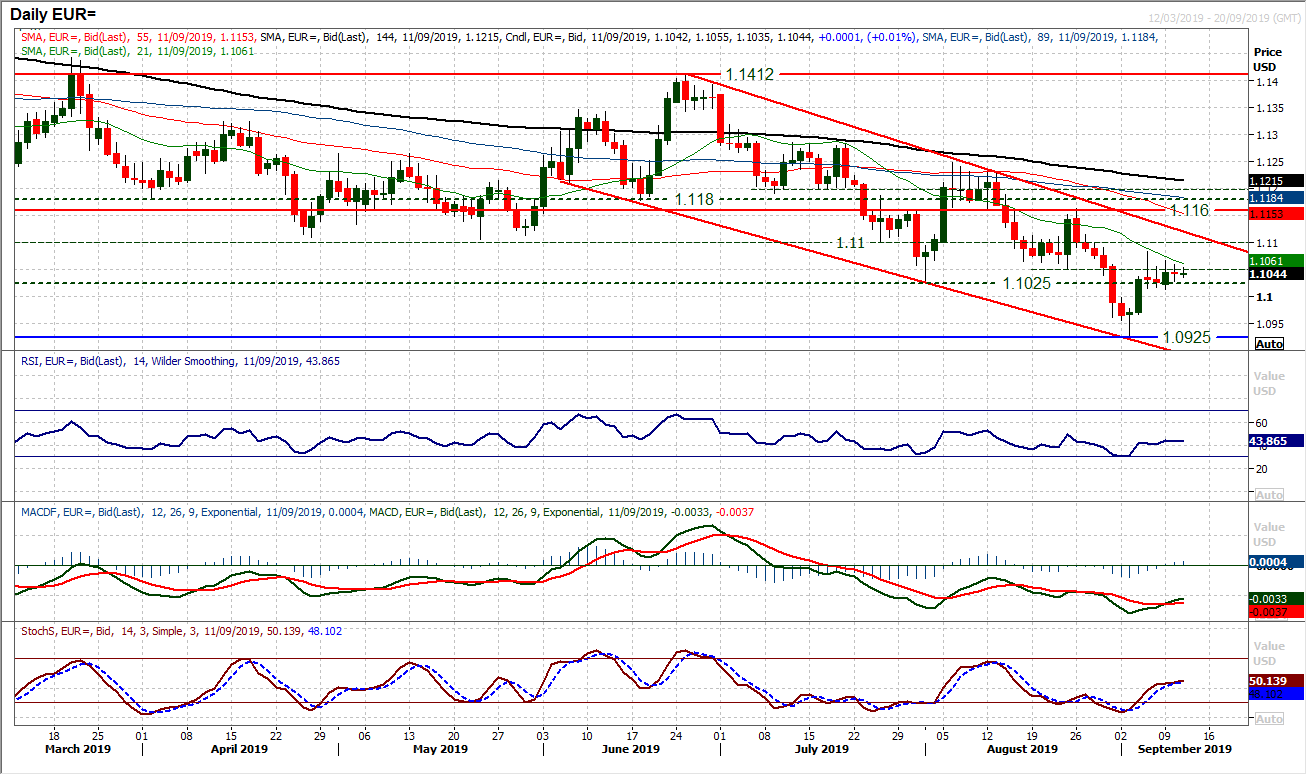
As the ECB approaches (Thursday at 1245BST) the euro has become increasingly rangebound. We have been discussing previously the resistance band of the old lows at $1.1025/$1.1050. With the candlestick bodies of each of the past four candles pretty much within this tight range, the market does not appear willing to take much of a view ahead of the ECB. The technical continue to reflect a medium term downtrend channel, along with negatively configured medium term momentum signals. Last week’s high at $1.1085 is the first real resistance whilst the channel resistance falls at $1.1120 today. Initial support is at Monday’s low of $1.1015 but any close below $1.1000 would be the bears getting back in control. Technicals suggest selling into strength still, but given the weakness already priced in ahead of expected easing, this could all change if the ECB fails to live up to expectations. For now though, we wait.
GBP/USD
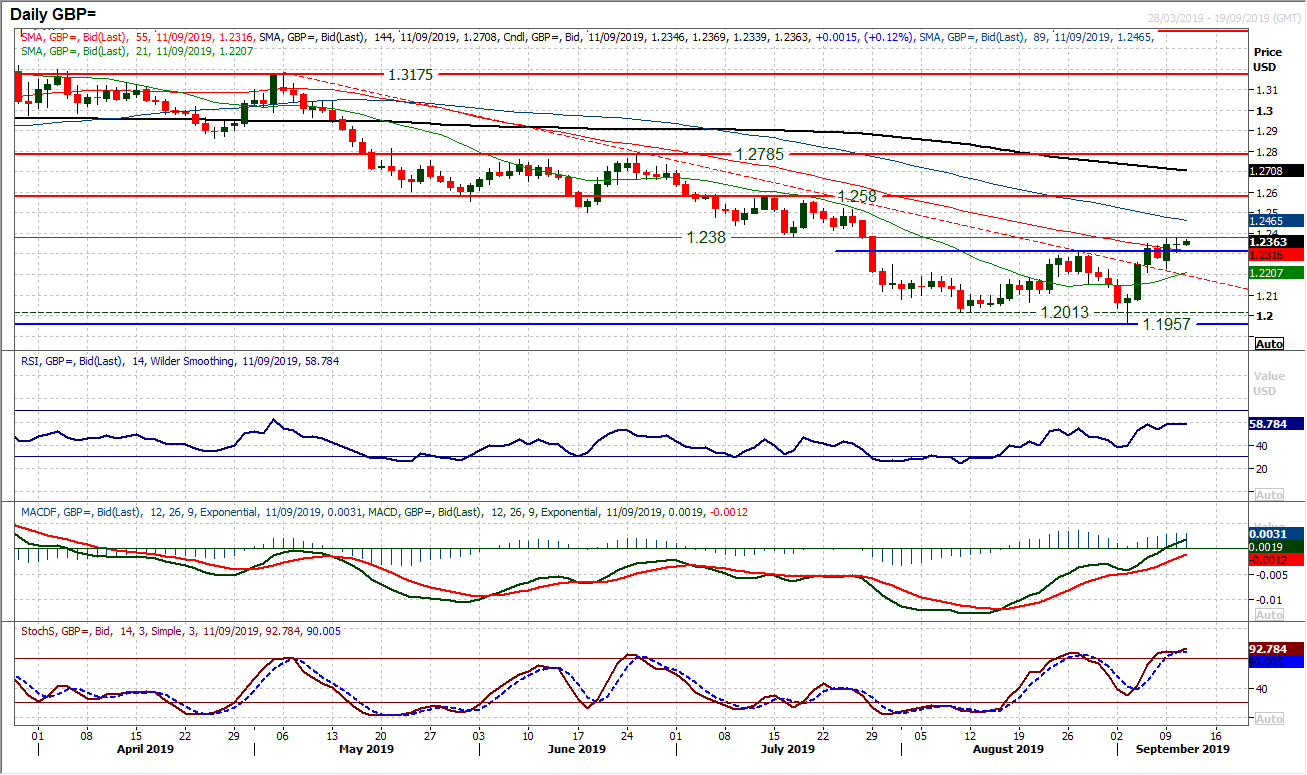
The Cable bulls are holding up well still as the improving outlook on sterling is standing its ground. Trading consistently above the $1.2305 breakout suggests that the bulls are unwilling to give in and a higher low at $1.2230 from Monday adds to the outlook. It is notable that the 21 day moving average, which has been either flat or falling since March, has now decisively started to pull higher. Trading above $1.2305 implies a recovery is on with the c. 300 pip target meaning a retest of the $1.2580 high is realistic. The immediate barrier standing in the way is resistance of the old July low at $1.2380, which has restricted the market since Monday. A close above would really open the move. Looking to buy into weakness for the breakout. Momentum indicators are still strong with the RSI in the high 50s, MACD lines on the brink of rising above neutral and Stochastics strong. The hourly chart shows continued solidly positive configuration on momentum, whilst building a basis of support around a pivot at $1.2300.
USD/JPY
The yen remains under pressure as another solid if unspectacular) candlestick was formed on USD/JPY yesterday. The recovery continues and has broken decisively through the overhead supply band 106.75/107.50 in a move that has changed the medium term outlook. This move is now also confirming decisively on momentum too, with RSI at four and a half month highs above 60, whilst MACD lines accelerate strongly towards neutral and Stochastics are strongly configured at five month highs. The breakout above 107.50 is now on course for a test of 109.00 which is the next key resistance. The old 106.75/107.50 band is now a basis of support again to look to capture any near term weakness and higher lows.

Gold
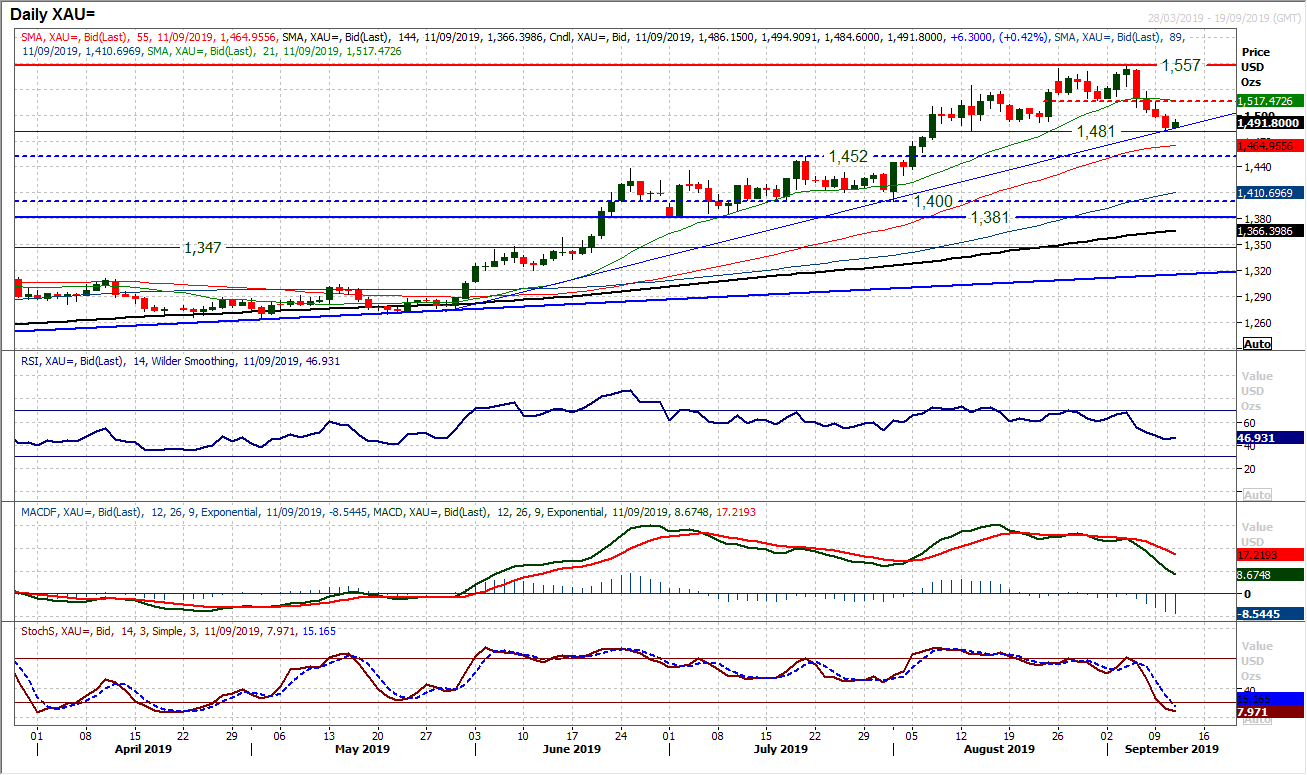
A fourth decisive negative candlestick in succession has significantly shaken the bulls from their perch. Whilst there is no longer a bullish configuration on price chart, or momentum, the next key question is whether the correction goes any deeper. For that we look to the support at $1481 which is the bottom of a consolidation band whose lows between $1481/$1492 held the market during August. A closing breach of $1481 would be a key signal that the bull market correction had further retracement. A tick higher from yesterday’s low at $1484 has held the market up for now, but there will need to be a concerted effort from the bulls now, as the momentum indicators have accelerated into corrective positions and are leading the market lower. An early bounce today needs to sustain and the hourly chart shows resistance $1501/$1502. Hourly RSI is failing around 55 and hourly MACD under neutral as intraday rallies are consistently being sold into. This needs to change. The bulls need to break back above resistance at $1515 with the 21 day moving average now a barrier around $1517 today.
WTI Oil
Yesterday’s negative candlestick has just posed a few questions for the bulls as the rally has been put on ice for the time being. The breakout to five week highs has seen a pullback into a support band $56.90/$57.75 and if the market can now build another higher low in this band, then the bulls will continue to drive the outlook. Momentum continues to edge positively higher, with RSI in the high 50s, MACD lines tentatively above neutral and Stochastics around two month highs. Initial resistance at $58.80 is a barrier but if this can be cleared the way is open for a move towards the July high of $61.00 (which momentum indicators are hinting towards). A breach of support at $56.60 would be disappointing now and open $54.80.

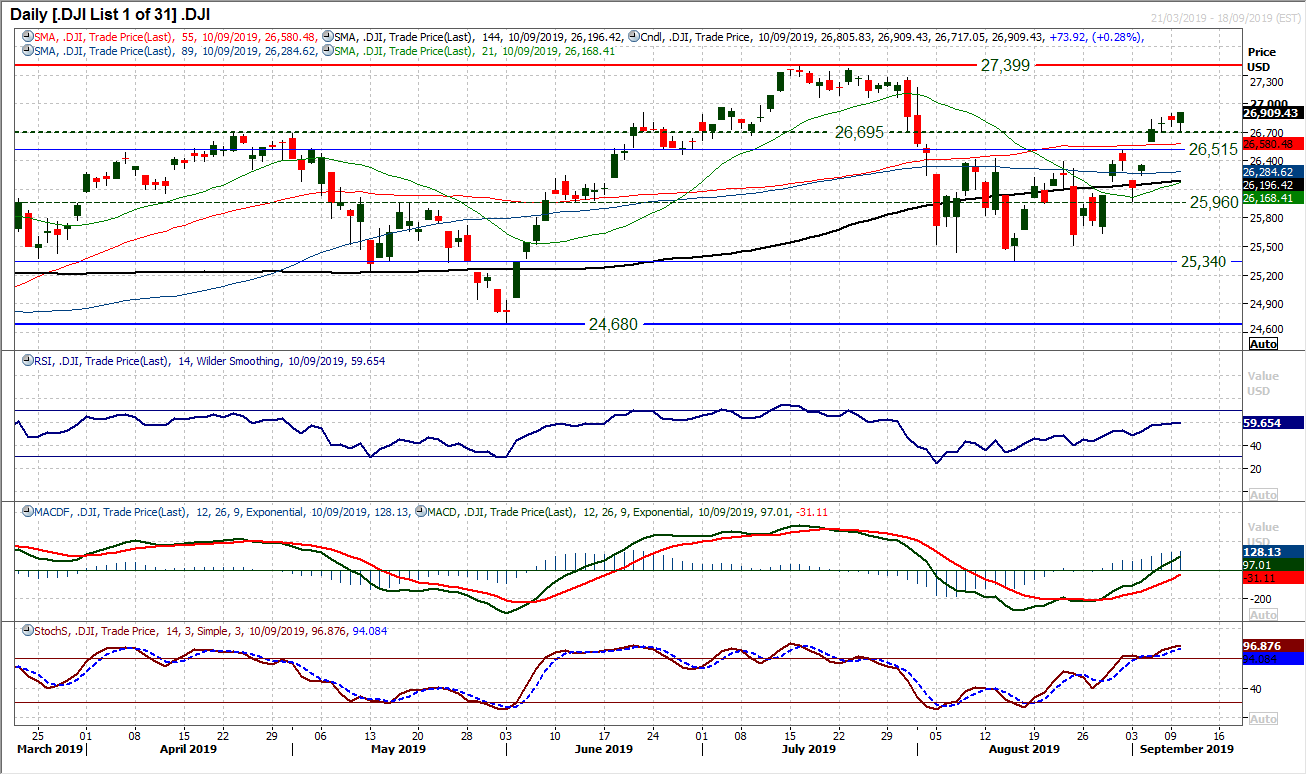
Dow Jones Industrial Average
Wall Street remains on track in the recovery. A slight wobble was seen around the turn of the week as a couple of neutral/negative candles formed, but despite this the market continues to pull higher. Now, with yesterday’s solid gains and close at the high of the day, the bulls are back in the driving seat. Momentum indicators all confirm the breakout to five week highs, with the RSI towards 60, MACD lines about to rise above neutral and Stochastics strongly configured. There is a strong sense of buying into weakness too. Although it was a relatively small daily range, yesterday’s candlestick was also a “bullish engulfing”, leaving a higher low at 26,715. The market is open for a move to the all-time high at 27,399 now, with initial resistance at 27,069/27,280. The neckline breakout of the base pattern at 26,425/26,515 is now a strong basis of underlying support.
Author

Richard Perry
Independent Analyst


