![]() HY Markets Research Team
HY Markets Research Team
HY Markets
EUR/USD
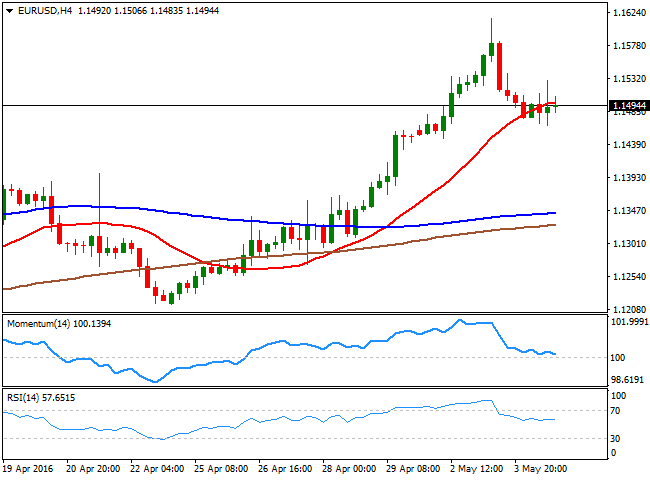
The greenback advanced some against most of its major rivals, edging sharply higher against the CAD and the AUD as commodityrelated currencies were weighed by falling oil and gold prices and poor local data. The common currency was unable to recover above the 1.1500 figure, and ended the day a handful of pips below the level against the greenback, with mixed data coming from both sides of the Atlantic being for the most mixed.The release of the final Services and Composite readings for the month of April in the EU, showed that activity grew at a slower pace than initially estimated, indicating a tepid start of the second quarter. Retail Sales in the EU, declined by 0.5% in March compared to the previous month, up by 2.1% compared to a year before, against expectations of a 2.5% advance. In the US, data came in mixed, with the ADP employment survey disappointing, as it showed that the private sector added 156,000 new jobs in March, although the Services sector grew by more than expected whilst new orders for U.S. factory goods also rose more than expected up by 1.1% after February's downwardly revised 1.9% decline. The 4 hours chart for the EUR/USD pair shows that the technical indicators have erased all of their extreme readings and stabilized above their midlines, with the Momentum indicator heading lower right above its100 level and the RSI flat around 57, whilst the price is unable to establish itself above a still bullish 20 SMA. The daily low was of 1.1469, showing that buying interest is aligned around the major support, yet at this point, the pair needs to advance firmly above the 1.1530 level to regain its previous positive tone and be able to retest the high at 1.1615. Below the mentioned support on the other hand, the price can decline down to 1.1380, and it will take a break below this last to deny the recently born bullish trend.
Support levels: 1.1500 1.1460 1.1420
Resistance levels: 1.1530 1.1565 1.1615
GBP/USD
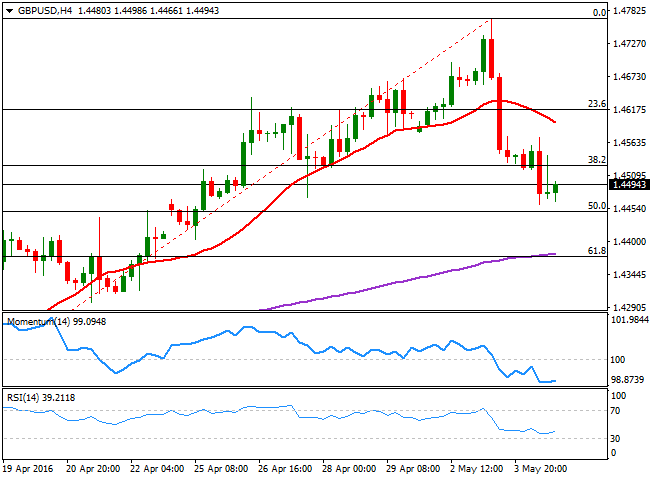
The Sterling fell against the greenback to its lowest in seven days, after the release of the UK Construction PMI, which showed that output growth eased to the weakest for almost three years, finally resulting at 52.0, amid stalling new business volumes in April, according to the Markit report. The GBP/USD pair fell down to 1.4460, bouncing from this last up to 1.4571 before losing momentum and closing the day below the 1.4500 mark. The daily chart shows that after over two weeks of advances, the pair retreated almost 50% in just two days, confirming that buying interest somehow faded. For the upcoming sessions, the risk is towards the downside, as in the 4 hours chart, the 20 SMA continues grinding lower well above the current level, whilst the technical indicators have lost their downward strength near overbought levels, but are far from indicating an upward move. Further slides below 1.4375, should see the decline extending down to 1.4450, the 61.8% retracement of the latest bullish run and the 200 EMA.
Support levels: 1.4450 1.4410 1.4375
Resistance levels: 1.4530 1.4580 1.4620
USD/JPY
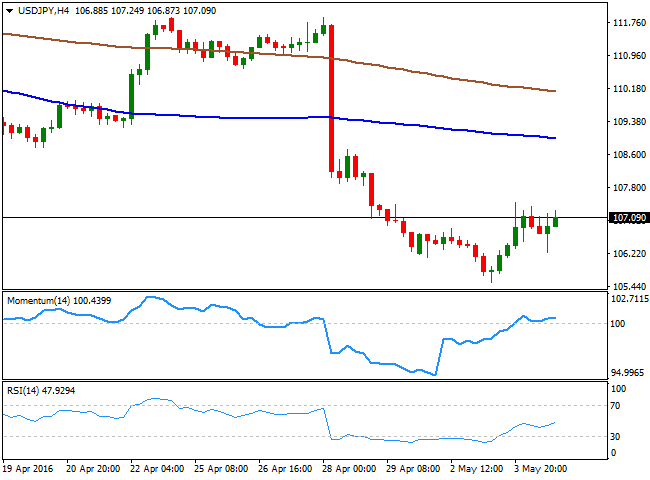
The USD/JPY pair trades around the 107.00 level as the US session ends, modestly higher daily basis, but maintaining the overall bearish tone seen on previous updates. With a long holiday going on in Japan, market players remain away from JPY crosses due to the lack of local clues, whilst a still weak greenback limits chances of a strong advance. The pair remained below Tuesday's high of 107.43, and the 1 hour chart shows that the price is a few pips above a bearish 100 SMA, still unable to clearly advance beyond it, whilst the technical indicators have reentered negative territory and present bearish slopes, keeping the risk towards the downside. In the 4 hours chart, this latest consolidation has helped indicators to correct extreme oversold readings, but are currently flat around their midlines, whilst the price is far below its 100 and 200 SMAs, all of which supports additional slides towards the 105.00 region, particularly if the ongoing negative mood prevails.
Support levels: 106.60 106.20 105.70
Resistance levels: 107.45 107.90 108.30
GOLD
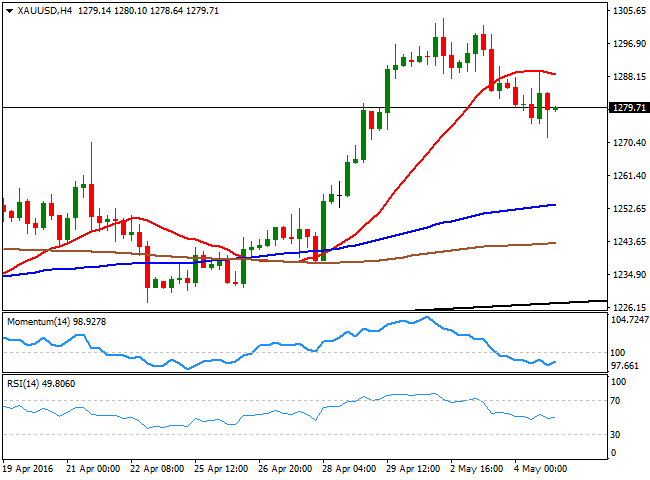
Gold prices edged once again lower this Wednesday, with spot down to $ 1,271.77 a troy ounce in the US afternoon, to close the day roughly at 1,280.00. The commodity retreated on dollar's strength, but also on speculation of a June US rate hike fueling some profittaking ahead of the Nonfarm Payroll report next Friday. Strong US data will most likely threaten the latest bullish trend in the bright metal, as it will point for more chances of a sooner rate hike. From a technical point of view, the daily chart shows a limited downward potential, as the price remains well above a still bullish 20 SMA, whilst the technical indicators have lost bearish strength within positive territory, after retreating from overbought readings. Shorter term, the 4 hours chart shows that the intraday spike up to 1,289.71 stalled right at a mild bearish 20 SMA, now the immediate resistance, whilst the technical indicators have turned slightly higher within negative territory, with no actual momentum at the time being, also limiting the downside.
Support levels: 1,271.80 1,262.30 1,252.60
Resistance levels: 1,289.70 1,297.10 1,308.40
WTI CRUDE
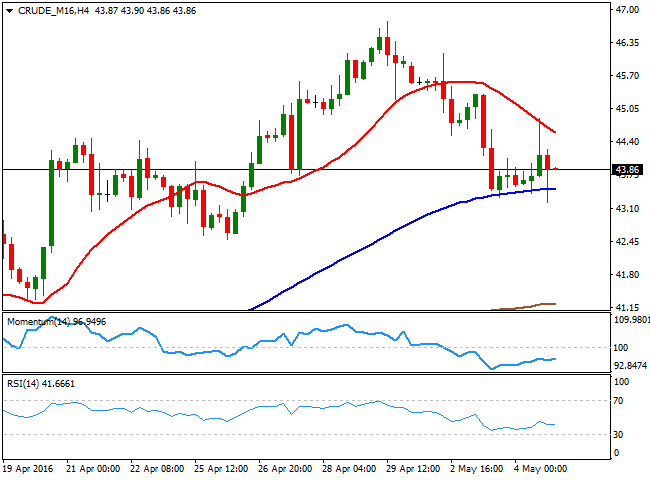
Crude oil prices started the day with a strong footing, with WTI advancing up to $44.86 a barrel, but the commodity trimmed all of its daily gains after the US government reported that commercial stockpiles rose by 2.8 million barrels in the previous week, almost doubling market's expectations. The American Petroleum Institute report released late Tuesday showed that US crude inventories rose by 1.3 million barrels. The daily chart shows that the commodity managed to close the day a few cents above a now horizontal 20 SMA, whilst the Momentum indicator turned lower within positive territory, and the RSI indicator stands flat at 56, suggesting an increasing downward potential yet to be confirmed. In the 4 hours chart, the 20 SMA heads strongly lower above the current level, capping the upside now around 44.60, while the technical indicators head nowhere within bearish territory, also supporting the need of additional confirmations before the bearish run begins.
Support levels: 43.20 42.50 41.80
Resistance levels: 44.60 45.10 45.80
DAX
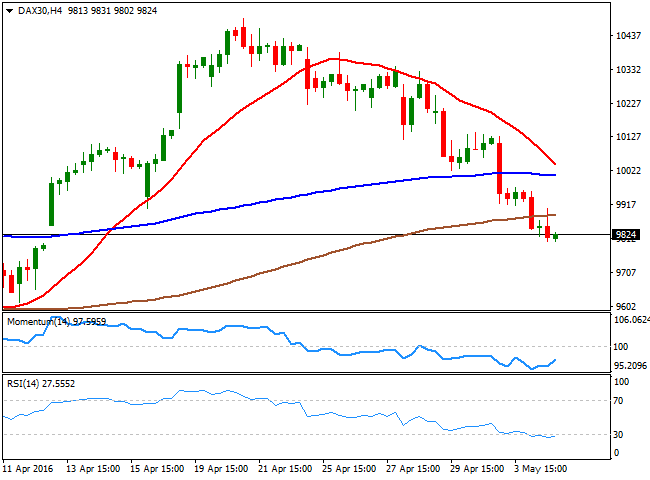
The German DAX shed 97 points this Wednesday to end the day at 9,828.25, a fresh 3week low, affected by another raft of weak earnings reports across Europe. Mining related shares suffered the most as commodities fell, but among local equities, Deutsche Telekom AG slipped 2.1% after posting a 2.5 percentdrop in German sales, even as total revenue beat forecasts and earnings rose. Fraport AG slid 6.1% percent after the operator of Frankfurt airport reported quarterly earnings and sales that missed estimates. The index remains near the mentioned close ahead of Asian opening, with the daily chart showing that it closed the day below its 100 SMA for the first time since early April, whilst the technical indicators have extended their declines within negative territory, maintaining strong bearish slopes and supporting some further declines. In the 4 hours chart, the technical indicators are turning modestly higher within oversold levels, but with the index near its low and below its moving averages, any upward corrective movement should result limited by selling interest now around the 10,000 figure.
Support levels: 9,802 9,741 9,685
Resistance levels: 9,867 9,914 10,000
DOW JONES
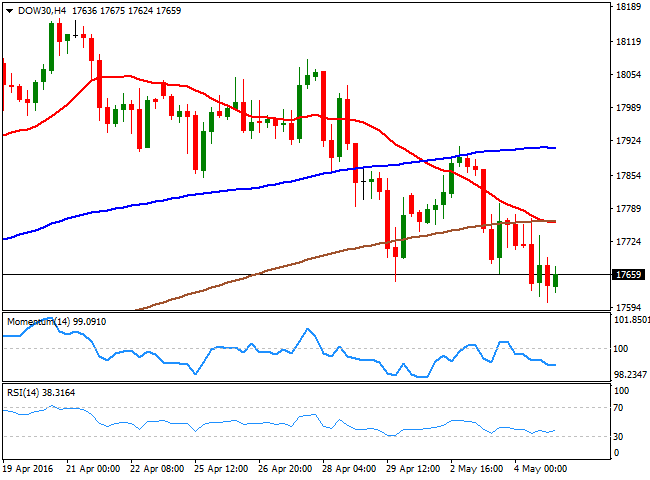
US stocks closed in the red, with the DJIA down 99 points to end at 17,651.26. The Nasdaq extended its decline by 37 points to end at 4,752.64 while the SandP fell 12 points to 2,051.12. Mixed data in the US continued suggesting the economy is struggling to slowly advance, with no signs of contraction, but neither of a strong pick up. Employment data disappointed, as the ADP survey printed 165K against 200K expected, while US productivity fell by a 1% annual rate in the first quarter, marking the fourth decline in the past six quarters. US trade deficit, however, shank to its lowest in a year during March, resulting in 40.40B. The DJIA daily chart shows that the index extended further below its 20 SMA, whilst the technical indicators gained additional bearish momentum within negative territory, maintaining the risk towards the downside for this Thursday. In the 4 hours chart, the 20 SMA has crossed below the 100 and 200 SMAs above well above the current level, reflecting the ongoing strong selling interest, whilst the technical indicators flattened near oversold levels, rather reflecting the lack of volume after the close that suggesting a downward exhaustion.
Support levels: 17,604 17,530 17,440
Resistance levels: 17,692 17,758 17,812
FTSE 100
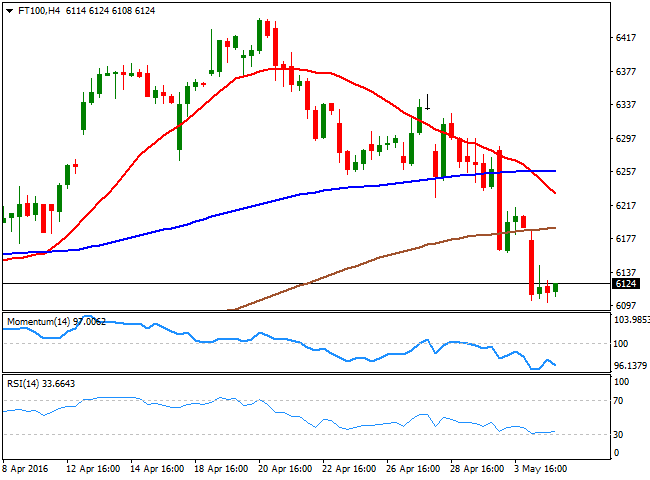
London shares extended their slides, and the Footsie closed at 6,112.02, down by 1.19% or 72 points. The index fell to near a 1month low as poor earnings reports sent the mining sector nosediving. Randgold Resources led the decline by plummeting 11.7% as, despite reporting a 13% rise in net profit to 54 million in the first quarter of 2016, the firm's metal production declined 11%, compared to the previous record quarter. BHP Billiton fell 5.8% after Brazilian prosecutors filed a $44 billion lawsuit against the miner and its partner Vale over the collapse of a dam that killed 17 people. Glencore lost 3% after reporting a cut in production of copper, zinc, lead, coal and oil as a result of low commodity prices. From a technical point of view, the daily chart shows a strong downward potential at the time being, as the index has plummeted below its 200 DMA and is now barely holding above the 100 DMA, whilst the technical indicators present sharp bearish slopes within negative territory. In the 4 hours chart, the technical picture also favors the downside, as the Momentum indicator resumed its decline near oversold levels, while the RSI indicator consolidates around 33.
Support levels: 6,101 6,062 6,006
Resistance levels: 6,155 6,214 6,256
The information set forth herein was obtained from sources which we believe to be reliable, but its accuracy cannot be guaranteed. It is not intended to be an offer, or the solicitation of any offer, to buy or sell the products or instruments referred herein. Any person placing reliance on this commentary to undertake trading does so entirely at their own risk.
Recommended Content
Editors’ Picks
AUD/USD remains firm above 0.6600 ahead of RBA

AUD/USD maintains its bullish bias well and sound on Monday, extending the multi-session recovery past the 0.6600 barrier ahead of the key interest rate decision by the RBA.
EUR/USD keeps the constructive tone near 1.0800

EUR/USD started the week in a positive note amidst the Dollar’s inconclusive price action, altogether motivating the pair to attempt a move to the proximity of the 1.0800 region, where the 200-day SMA also converges.
Gold holds on to modest gains around $2,320

Gold trades decisively higher on the day above $2,320 in the American session. Retreating US Treasury bond yields after weaker-than-expected US employment data and escalating geopolitical tensions help XAU/USD stretch higher.
Bitcoin price holds above $63K as MicroStrategy tops BTC ownership list

Bitcoin (BTC) price recorded a rather bold two days this past weekend in a surge that saw millions in positions liquidated. However, the week is off to a calm start with altcoins sucking liquidity from the BTC market.
Stagflation warning: Service economy contracts as prices rise

In another stagflation warning sign, the U.S. service sector contracted in April even as service prices rose. The Institute for Supply Management's non-manufacturing PMI dropped to 49.4 in April, dipping from 51.4 in March.