![]() HY Markets Research Team
HY Markets Research Team
HY Markets
EUR/USD
Federal Reserve, the Bank of Japan decided to stay path, with Kuroda saying they need more time to assess the effects of negative rates. The EUR/USD pair, despite reaching a fresh weekly high of 1.1367, was unable to benefit much, as data coming from both shores of the Atlantic, resulted mixed. In Germany, unemployment fell by 16,000 and wages grew during April, but harmonized inflation fell into negative territory, down 0.3% monthly basis, and by 0.1% compared to a year before.US data was also mixed as the advanced GDP for Q1 showed the economy grew at an annualized rate of 0.5% against the 0.7% expected, the slowest pace in two years, underlying the slowdown suffered by the US economy since the last quarter of 2015. Core CPE on the other hand, jumped to 2.1% during the quarter, which could heighten expectations that the Fed could act sooner than expected, particularly if the economy gives some signs of further recovery.Having advanced for a fourth consecutive day, the EUR/USD pair has broken above the 1.1315 Fibonacci level early Asia, and retracements towards the level during the next sessions attracted buying interest. Nevertheless, the 4 hours chart presents a neutraltobullish stance, as the technical indicators head nowhere within positive territory, but the price is above its moving averages, with the 20 SMA heading north around 1.1310. The pair has still to beat the strong resistance in the 1.1380/90 region to be able to advance further, eyeing then a retest of the 1.1460 price zone, a major long term resistance level.
Support levels: 1.1315 1.1270 1.1230
Resistance levels: 1.1385 1.1420 1.1460
GBP/USD
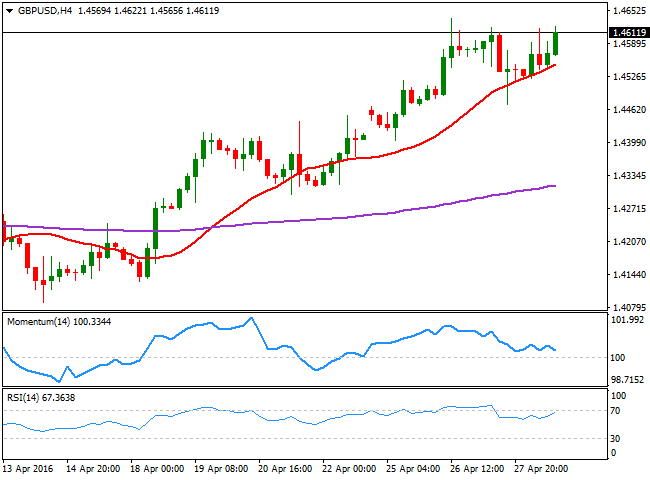
The GBP/USD pair consolidates in the upper end of its recent range, advancing modestly above the 1.4600 level by the end of the day on broad dollar's weakness. The pair has lost upward traction after reaching 1.4637 earlier this week, but there are no technical signs suggesting the greenback may reverse its recent losses against the Pound, furthermore, as Brexit fears have continued to decrease. From a technical point of view, and according to the 4 hours chart, the pair can keep rallying on a break above the mentioned weekly high, given that approaches to a bullish 20 SMA, currently around 1.4550, have steadily attracted buying interest, indicating speculative interest is waiting for dips. In the same chart, the RSI indicator heads north around 67, supporting the upward bias, but the momentum indicator presents some limited bearish divergences, yet to be confirmed, by posting lower highs within positive territory.
Support levels: 1.4590 1.4550 1.4510
Resistance levels: 1.4640 1.4685 1.4720

USD/JPY
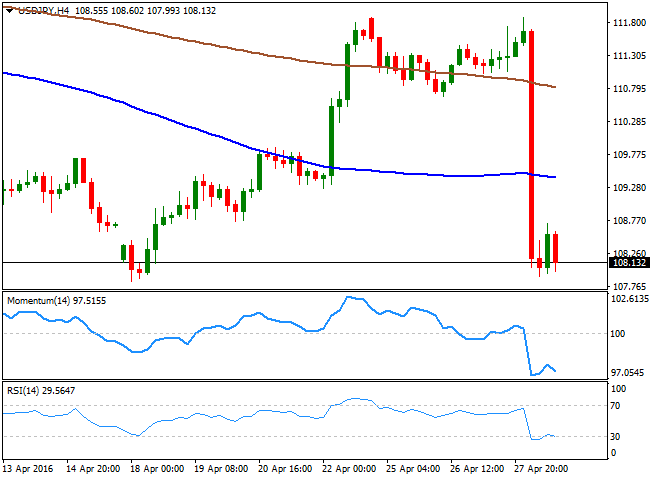
The USD/JPY pair plummeted to 107.91, its lowest since April 18th, after the Bank of Japan said, in its monthly meeting, that it needs more time to assess the impact of negative interest rates, and decided to maintain its monetary policy unchanged. The announcement caught investors wrongfooted, as over the past three weeks, they have been steadily pricing in some action from the BOJ. The JPY came back with a vengeance, and the USD/JPY pair is poised to extend its decline, particularly on a break below the 107.60 region, where it established a triple floor late March/early April. Intraday technical readings support such decline, given that in the 1 hour chart, the technical indicators have corrected extreme oversold readings, but the Momentum indicator remains below its 100 level, whilst the RSI indicator consolidates around 26. In the 4 hours chart, the technical indicators have resumed their declines after a limited upward corrective move, also indicating that further slides are likely for this Friday.
Support levels: 107.60 107.20 106.80
Resistance levels: 108.35 108.70 109.10
GOLD
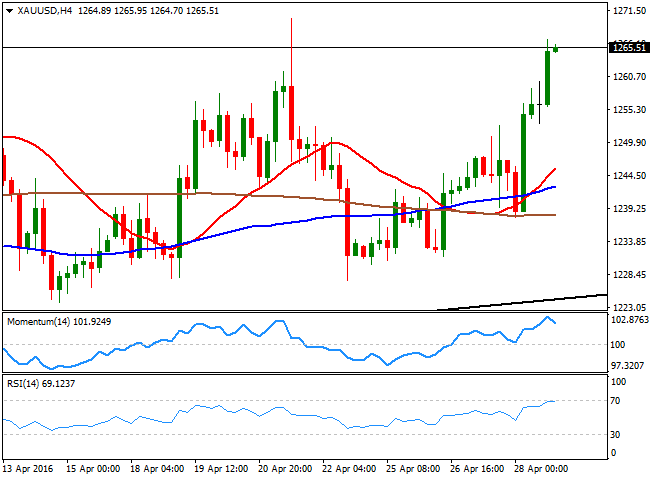
Spot gold rallied to a fresh weekly high of $ 1,269.57 and settled nearby by the end of the day as the dollar fell sharply after the FED and the BOJ, both held fire on economic policies. The first brought some relief to gold bulls, who usually become reluctant on prospects of a rate hike, while the second sparked a selloff in worldwide equities and US futures. The bright metal is beginning to look more constructive towards the upside, as in the daily chart, the price is finally detaching from its 20 SMA now turning higher around 1,241.80, whilst the technical indicators are advancing above their midlines, particularly the RSI that heads north around 61. Shorter term, the 4 hours chart shows that the price is now well above its moving averages, with the 20 SMA advancing modestly above the 100 and 200 SMAs, and the technical indicators beginning to lose upward strength within overbought territory. Nevertheless, and as the price remains near the daily high, the risk remains towards the upside, with scope to extend its rally up to 1,283.50 the high set on March 11th.
Support levels: 1,261.40 1,252.80 1,242.30
Resistance levels: 1,271.80 1,283.50 1,290.90
WTI CRUDE
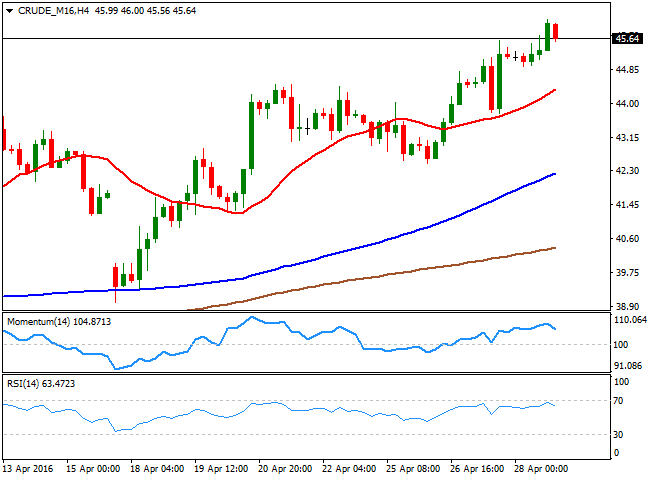
West Texas Intermediate futures broke higher this Thursday, extending beyond $45.00 a barrel for the first time since early November 2015 and stretching its rally up to 46.12 intraday, to finally end the day around 45.65. News that US output has begun to decrease have sparked hopes that the worldwide glut will begin to ease sooner than later, despite stockpiles reached an all time peak of 540.6 million barrels. Oil's recovery was underpinned by generalized dollar's weakness, and the daily chart supports some additional advances, given that the commodity has managed to post a higher high and a higher low for third consecutive day, whilst the 20 SMA has accelerated its advance, and currently stands at 42.20. In the same chart, the RSI indicator maintains its upward slope around 67, although the Momentum indicator diverges lower within positive territory. In the 4 hours chart, the technical indicators are easing from near overbought levels, but remain well above their midlines, whilst the moving averages head firmly higher well below the current level, supporting some additional gains towards the 40.20/50.00 region for the upcoming days.
Support levels: 45.50 44.80 44.20
Resistance levels: 46.40 47.10 47.80
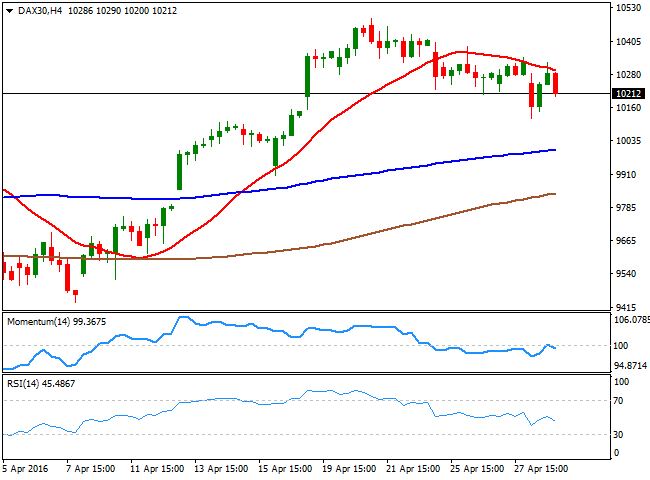
DAX
Europe closed mixed, weighed by the negative tone of Asian shares markets, but underpinned by further gains in oil prices. The German DAX advanced 21 points and closed the day at 10,321.15. German bond yields fell on relief that the Fed failed to signal a rate hike for June, whilst among stocks, Deutsche Bank led the advance by adding 4% as the German lender’s first quarter profit beat analyst expectations. The benchmark, however, capitulated in afterhours trading, shedding over 100 points after the close as US stocks plunged. The decline seems mostly corrective at this point in the daily chart, as the index is barely below its 200 DMA, but well above the 20 and 100 SMAs, whilst the technical indicators have turned slightly lower from overbought territory, but are well above their midlines. In the 4 hours chart, the technical picture favors the downside, as the indicators have turned south after failing to overcome their midlines, whilst the index continues developing below its 20 SMA that slowly gains bearish strength.
Support levels: 10,264 10,201 10,151
Resistance levels: 10,385 10,430 10,491
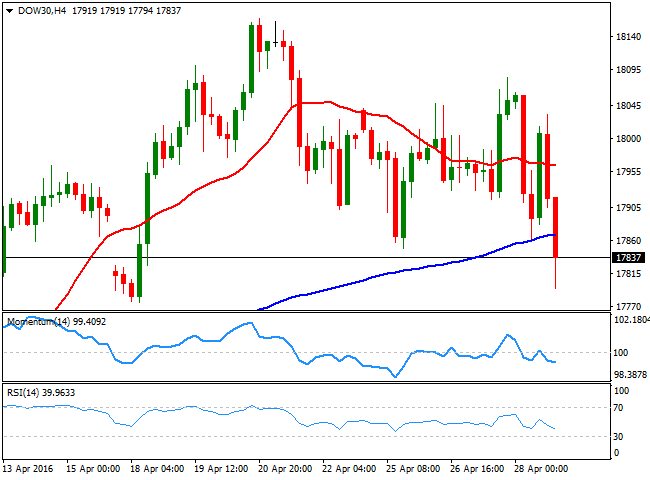
DOW JONES
US stocks ended sharply lower on Thursday after data showed US GDP growth advanced at its slowest pace in two years and jobless claims rose more than expected. The Dow Jones Industrial Average lost 210 points, or 1.17%, to close at 17,830.76, recording the biggest oneday drop since February 11th. The S and P 500 fell 19 points, or 0.92%, to 2,075.81 while the Nasdaq dropped 57 points, or 1.19%, to 4,805.29. On the data front, US GDP slowed to 0.5% in the first quarter according to the advance estimate, missing expectations of 0.7% growth. Separated data showed initial jobless claims rose more than expected to 257K in the week ended Apr 22, raising concerns over the economic health of the world's largest economy. As for the technical picture, the DJIA daily chart shows that the index fell below its 20 SMA for the first time in over two weeks, whilst the technical indicators have turned sharply lower, but are not yet breaking into negative territory. In the 4 hours chart, the technical outlook is bearish, given that the technical indicators maintain strong bearish slopes well below their midlines, while the index is now below its 20 and 100 SMAs.
Support levels: 17,775 17,730 17,651
Resistance levels: 17,904 17,985 18,046
FTSE 100
The FTSE 100 closed the day pretty much flat, up by 2 points to 6,322.40, trimming its daily losses as mining related shares edged sharply higher, outweighing losses in the banking sector. Tullow Oil was the best performer up by 11% as oils´ prices advanced to fresh 2016 highs, while Anglo American advanced 8% after it said it had agreed the sale of its niobium and phosphates businesses to China Molybdenum for $1.5bn. The Footsie however, fell in futures trading, tracking Wall Street's losses, and currently stands around 6,270, looking weaker in the daily chart, as the index is now below its 20 SMA whilst the technical indicators have turned lower within positive territory, and are poised to break below their midlines. In the shorter term, the 4 hours chart shows that the index has met intraday selling interest on attempts to advance beyond a bearish 20 SMA, whilst the technical indicators have turned lower around their midlines, supporting a continued decline beyond the 6,200 region and beyond, should the negative mood persists this Friday.
Support levels: 6,206 6,157 6,101
Resistance levels: 6,310 6,368 6,440

The information set forth herein was obtained from sources which we believe to be reliable, but its accuracy cannot be guaranteed. It is not intended to be an offer, or the solicitation of any offer, to buy or sell the products or instruments referred herein. Any person placing reliance on this commentary to undertake trading does so entirely at their own risk.
Recommended Content
Editors’ Picks
AUD/USD extends its upside above 0.6600, eyes on RBA rate decision

The AUD/USD pair extends its upside around 0.6610 during the Asian session on Monday. The downbeat US employment data for April has exerted some selling pressure on the US Dollar across the board. Investors will closely monitor the Reserve Bank of Australia interest rate decision on Tuesday.
EUR/USD: Optimism prevailed, hurting US Dollar demand

The EUR/USD pair advanced for a third consecutive week, accumulating a measly 160 pips in that period. The pair trades around 1.0760 ahead of the close after tumultuous headlines failed to trigger a clear directional path.
Gold holds below $2,300, Fedspeak eyed

Gold price loses its recovery momentum around $2,295 on Monday during the early Asian session. Investors will keep an eye on Fedspeaks this week, along with the first reading of the US Michigan Consumer Sentiment Index for May on Friday.
Bitcoin Cash could become a Cardano partnerchain as 66% of 11.3K voters say “Aye”

Bitcoin Cash is the current mania in the Cardano ecosystem following a proposal by the network’s executive inviting the public to vote on X, about a possible integration.
Week ahead: BoE and RBA decisions headline a calm week

Bank of England meets on Thursday, unlikely to signal rate cuts. Reserve Bank of Australia could maintain a higher-for-longer stance. Elsewhere, Bank of Japan releases summary of opinions.