EUR/USD: bearish momentum to accelerate below 1.0520

EUR/USD Current price: 1.0533
View Live Chart for the EUR/USD
The EUR/USD pair plunged to the 1.0530 region, despite better-than-expected European data, as FED's Harker revived hopes for a March rate hike, after hinting he would support a rate hike next month if inflation keeps raising. In the EU, economic growth continues rising at a fast pace according to the preliminary February Markit PMIs, as the region's Markit Composite PMI registered 56.0 against previous 54.4, with the manufacturing and the services sectors' readings also beating expectations and previous month figures. The US session will bring a couple of FED's speakers and the Markit flash February PMIs, which if beat expectations, will probably see the EUR/USD pair breaking towards new monthly lows.
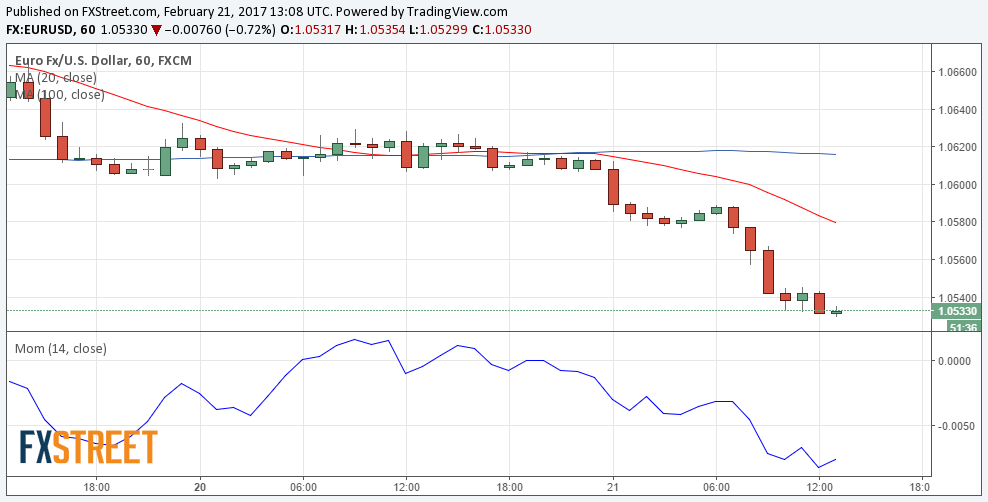
From a technical point of view, further slides are likely, as in the 1 hour chart, the price stands well below a now bearish 20 SMA and the major Fibonacci level at 1.0565, whilst technical indicators have partially lost bearish momentum, but remain within oversold levels. In the 4 hours chart, the 20 SMA turned south around 1.0630, reinforcing the static resistance area, whilst the RSI indicator keeps heading south around 28 and the Momentum also maintains its downward slope within oversold readings.
Support levels: 1.0520 1.0480 1.0430
Resistance levels: 1.0565 1.0600 1.0635
GBP/USD Current price: 1.2416
View Live Chart for the GBP/USD
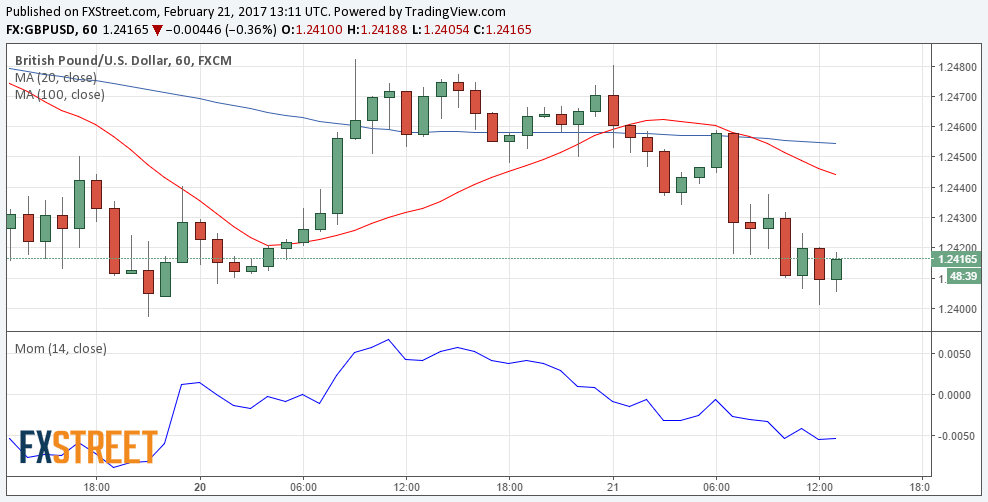
The GBP/USD pair fell to a daily low of 1.2401, dragged lower by generalized dollar's demand. BOE's Governor Carney testified before the Treasury Committee this morning, reiterating that the Bank is open to change its monetary policy one way or the other, if deemed appropriate. Trading at the lower end of its latest range, the scale leans towards the downside in the short term, given that in the 1 hour chart, the 20 SMA has accelerated its decline well above the current level, whilst technical indicators remain within negative territory, although with no clear directional strength. In the 4 hours chart, the 20 SMA heads modestly lower around 1.2430, while the Momentum indicator hovers around its 100 level, but the RSI heads south around 40, in line with further slides on a break below 1.2380, the immediate support.
Support levels: 1.2380 1.2345 1.2300
Resistance levels: 1.2430 1.2485 1.2530
USD/JPY Current price: 113.65
View Live Chart for the USD/JPY
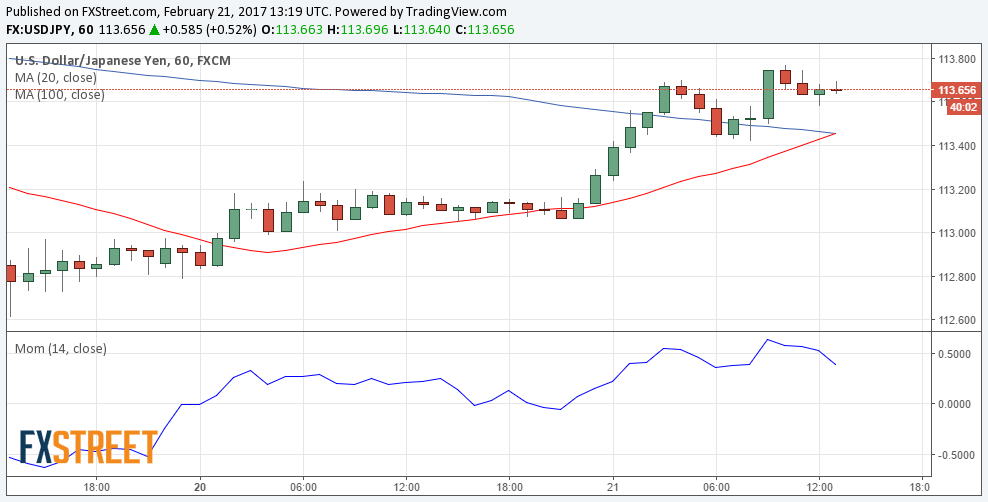
Upside still seen limited. The USD/JPY pair recovered some ground this Tuesday, trading not far from a daily high of 113.77, but the safe-haven currency is not ready to capitulate against its American rival, as high levels of political uncertainty remain in the background. The Japan flash manufacturing PMI expanded to 53.5 in February from 52.7 in January, the highest reading in almost three years. Also underpinning the positive sentiment among local investors. Technically, the upward potential is limited, as in the 1 hour chart, the price settled a handful of pips above its 100 and 200 SMAs, with the 100 SMA still heading south below the largest, while technical indicators have lost upward strength within positive territory. In the 4 hours chart, technical indicators head north within positive territory, but a bearish 100 SMA caps the upside around 113.90. Advances up to the 114.60 region are possible, but selling interest will probably reject advances around this last.
Support levels: 113.30 112.90 112.50
Resistance levels: 113.90 114.25 114.60
AUD/USD Current price: 0.7655
View Live Chart for the AUD/USD
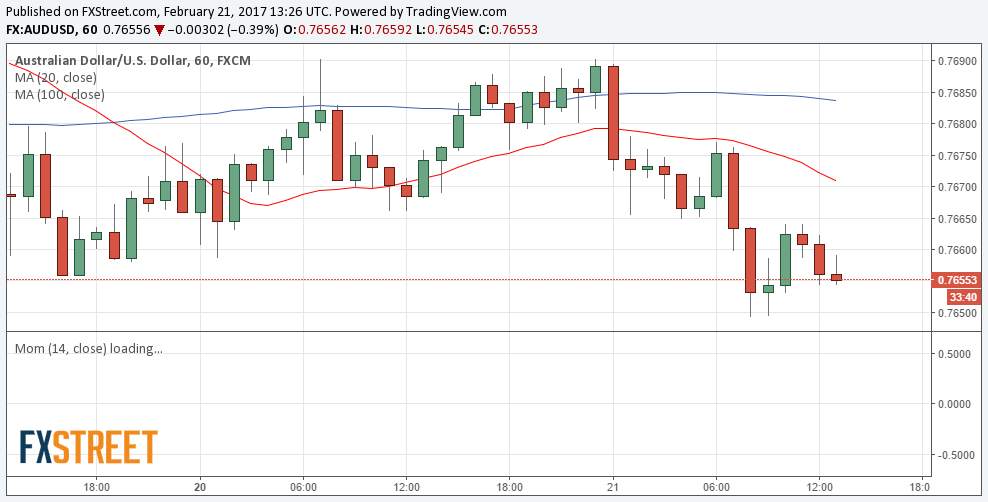
The AUD/USD pair fell to 0.7649, a fresh weekly low following the release of the RBA latest Minutes. The document was quite disappointing, with policymakers taking notice of poor GDP growth, and expressing concerns about the high value of the local currency. Chances of a rate hike are now out of the table, at least for the next few months. The short term picture is bearish, as the price is well below a bearish 20 SMA whilst technical indicators head south within negative territory. Still, a break below 0.7600 is required to confirm a downward extension. In the 4 hours chart, the price retreats further after failing to surpass a now bearish 20 SMA, whilst technical indicators diverge from each other, with the Momentum aiming higher and the RSI heading south, reflecting the ongoing range rather than suggesting an upcoming directional move.
Support levels: 0.7605 0.7575 0.7530
Resistance levels: 0.7695 0.7735 0.7770
Author

Valeria Bednarik
FXStreet
Valeria Bednarik was born and lives in Buenos Aires, Argentina. Her passion for math and numbers pushed her into studying economics in her younger years.


