Dow Jones Index bullish breakout aims at 35,000 target
-
Dow Jones Index (US 30) is building a bull flag continuation chart pattern within a larger uptrend. A bullish breakout should confirm a push higher.
-
The US 30 chart needs a break above the resistance trend lines (orange) to confirm a continuation of the uptrend (green arrows).
-
On the 1 hour chart, price action seems to be building a sideways correction after showing strong bullish impulse (wave 3 green).

Let’s review the price and wave patterns plus review the main targets and what-if scenarios.
Price charts and technical analysis
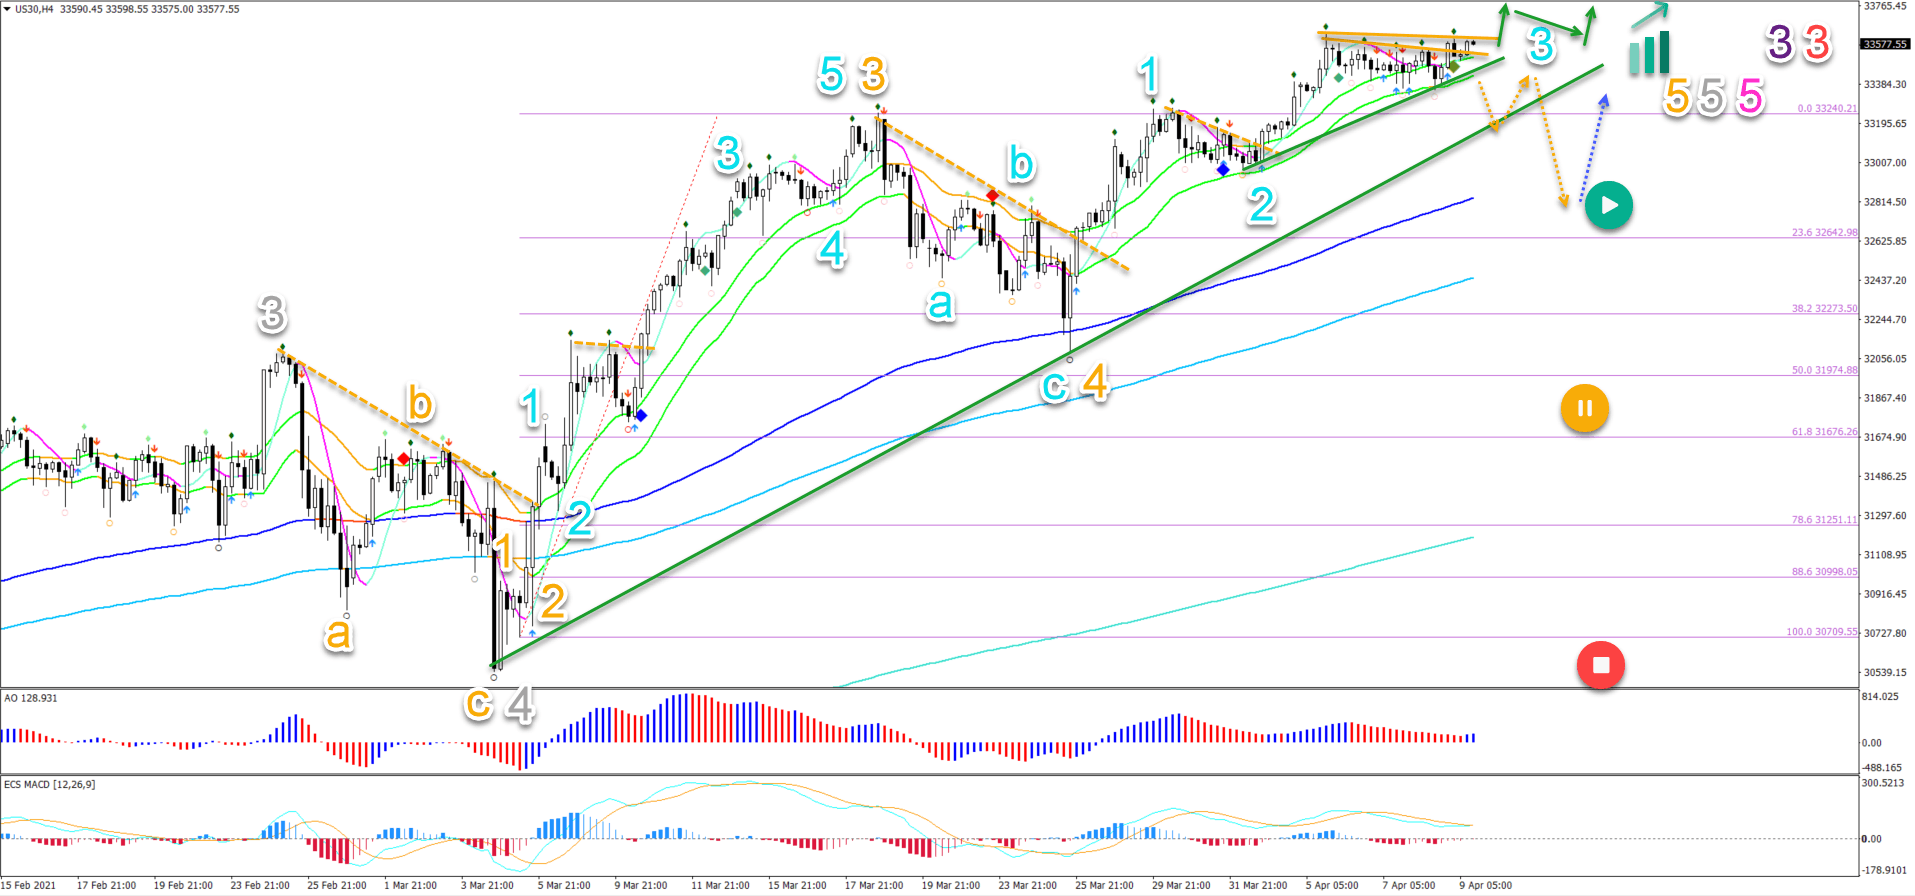
The US 30 chart needs a break above the resistance trend lines (orange) to confirm a continuation of the uptrend (green arrows):
-
The bullish breakout could confirm a wave 3 (light blue) pattern.
-
The larger wave analysis is indicating a strong uptrend with a potential wave 3 (purple) of wave 3 (red).
-
Recently price completed an ABC (light blue) within wave 4 (orange) at the 38.2% Fibonacci level and 144 ema close. The -27.2% Fibonacci target of that price swing is located at 34,000.
-
But a wave 3 (light blue) could go as far as 34,600 or even 35,000 before losing momentum, if this is a wave 3.
-
Any bearish breakout (orange dotted arrow) would invalidate this immediate bullish outlook. Although the long-term trend is still up and therefore any retracement could simply find support at the 144 ema close (blue dotted arrow).
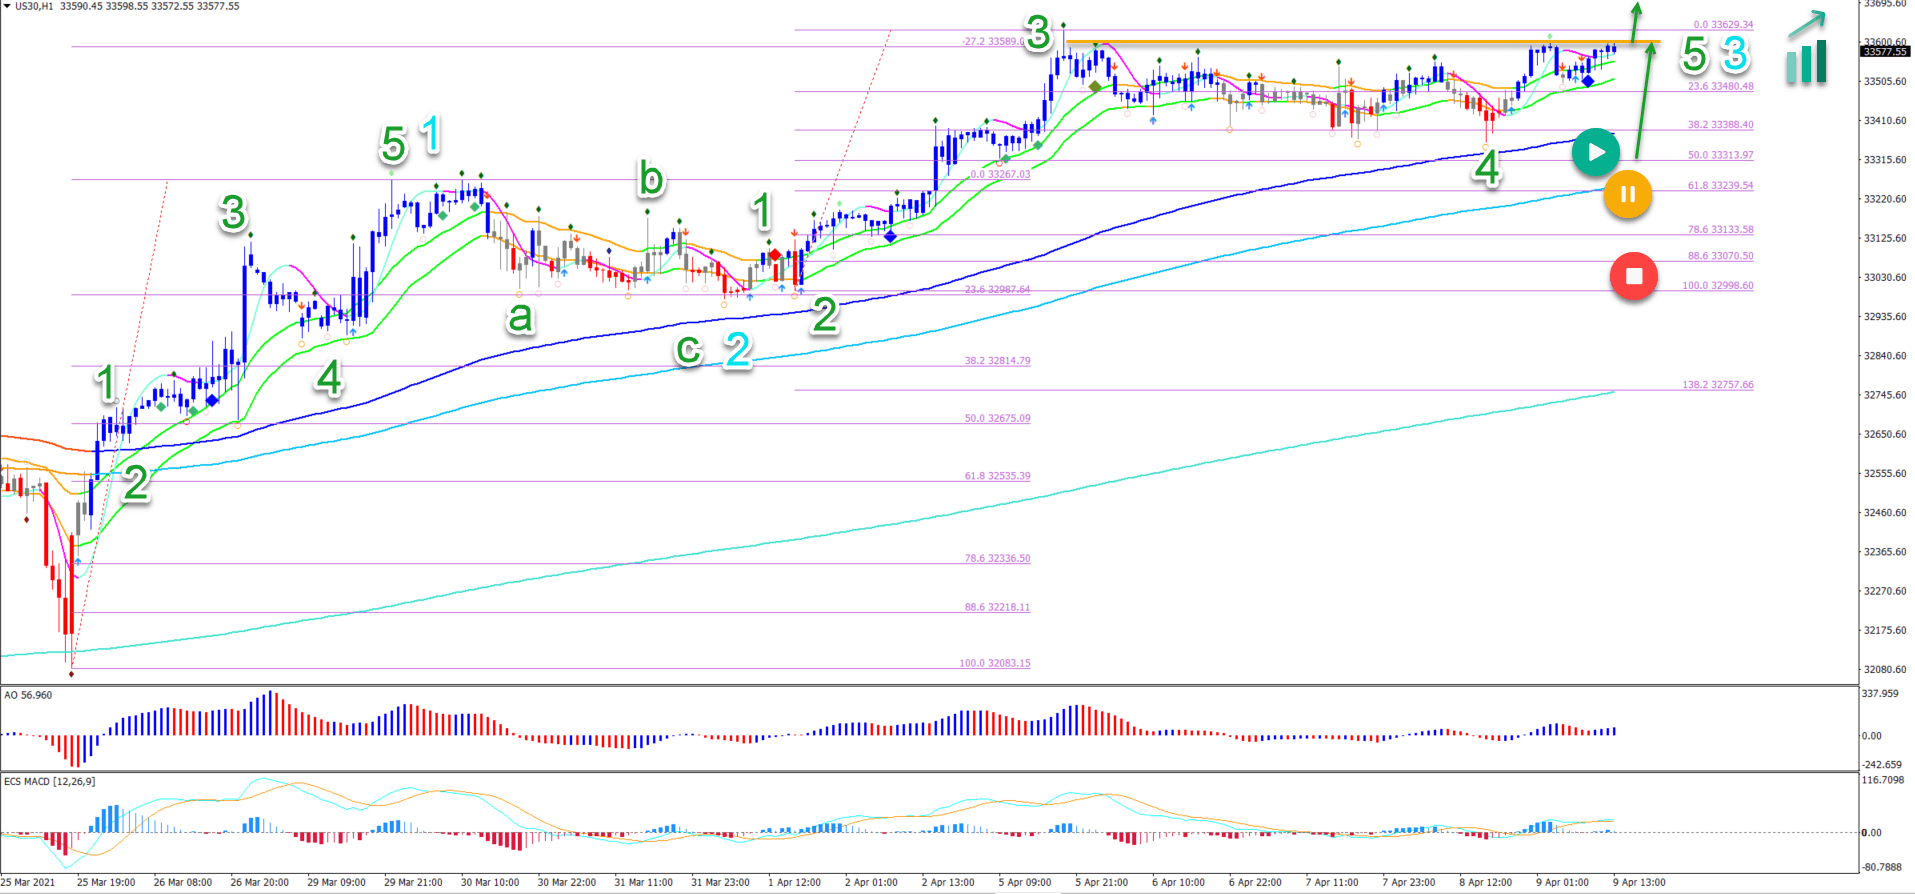
On the 1 hour chart, price action seems to be building a sideways correction after showing strong bullish impulse (wave 3 green):
-
The sideways range is probably a wave 4 (green), which respected the 38.2% Fibonacci level.
-
A bullish breakout could indicate a push higher. Perhaps as part of the wave 5 (green).
-
A pullback to the 50% Fibonacci level could still be a bouncing spot.
-
Only a deeper break places this wave outlook in danger. But the uptrend still remains intact even if price action retraces, just with a different wave scenario.
The analysis has been done with the ecs.SWAT method and ebook.
Author

Chris Svorcik
Elite CurrenSea
Experience Chris Svorcik has co-founded Elite CurrenSea in 2014 together with Nenad Kerkez, aka Tarantula FX. Chris is a technical analyst, wave analyst, trader, writer, educator, webinar speaker, and seminar speaker of the financial markets.


