Doubts over the Fed and Trump drive dollar selling

Market Overview
There are doubts in the minds of traders over Fed monetary policy and the ability for Trump to deliver that are driving selling pressure on the dollar. Firstly, doubts over whether the Fed will engage a third hike this year with ongoing concerns over the lack of inflation. However these fears have been exacerbated by doubts on Donald Trump to be able to deliver the kind of reform he promised. The reform of healthcare and the repeal of Obamacare seems to be dying in Congress as an increasing number of Republicans become opposed. If Trump cannot get healthcare reform through then how is he going to achieve the more controversial fiscal plans through? The dollar has had another leg lower as a result, coming under renewed weakness across the major currencies. Treasury yields are lower, gold is up. But interestingly, equities are struggling too. Despite the apparent dovish implications of all this on Fed monetary policy, the underlying negative economic implications are putting doubts in the minds of equities investors too.

Wall Street closed all but flat on a very quiet session, with the S&P 500 again at 2459. Asian markets were lower with the Nikkei -0.6% and back below 20,000, whilst European markets are also weaker today. In forex, there is widespread dollar weakness, with the incredible run driving the Aussie dollar to its highest level since May 2015. In commodities, gold continues to recover, whilst oil has come under a little corrective pressure as it has backed away from key resistance.
Sterling traders will especially be looking towards the UK inflation numbers at 0930BST to drive volatility. Expectation is that headline UK CPI will stay broadly the same at +2.9% which will continue to put pressure on the Bank of England rate setting committee which is increasingly concerned by the high levels of inflation. However, could it be that after rising consistently for over 18 months, the market will be looking to see if the trend is beginning to roll over. Core UK CPI is also expected to stay at 2.6%. However it is interesting to see the PPI input prices continuing to fall away, expected to be back into single figures at +8.7% for the year, having been as high as 19.9% back in January as sterling has recovered from its lows. The German ZEW Economic Sentiment is at 1000BST and is expected to dip back slightly to +17.6 (from +18.6 last month) which would be a second month of decline. The ZEW gives a useful read through to German growth numbers and could subsequently have an impact on the euro and also German yields today. US data is light and only really the NAHB Housing Market Index will be of any significant interest at 1500BST and is expected to stay at 67.
Chart of the Day – AUD/USD
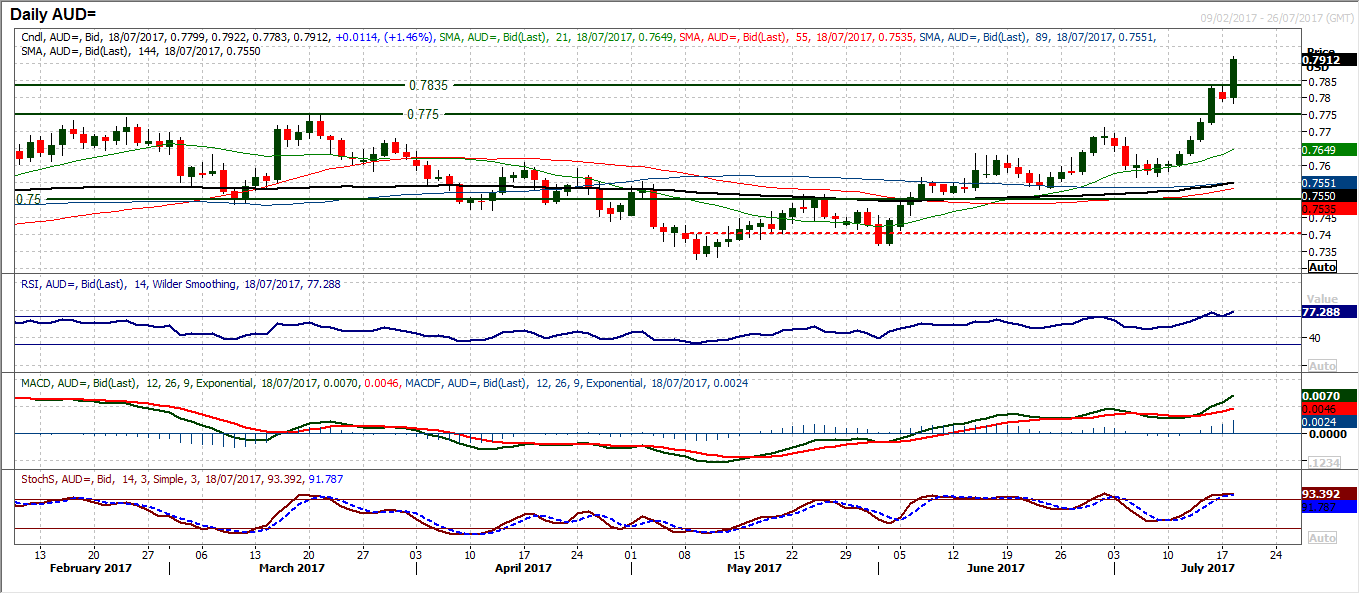
The recent run higher on the Aussie has been incredible. A huge accelerating bull run has seen the market burst through the key 2017 high of $0.7750 to now see what looks to be a huge breakout above the April 2016 high of $0.7835. The market has been limited by the resistance band $0.7750/$0.7835 on numerous occasions in the past 18 months but the weakness of the dollar has driven a breakout. Chasing the Aussie higher here would though be a move filled with significant risk. The RSI at 77 is higher than it has been at any time since November 2013. Momentum is clearly strong but also incredibly stretched. Staying with the bull run may be profitable in the very near term, however if profit taking hits, it could be a sharp reversal. Watch for exhaustion signals. On the Bollinger Bands, it is also notable that the entirety of yesterday’s session took place outside the 2.0 standard deviations band. The bulls were looking tired before the sharp gains of today, but again the move looks stretched and a close back inside the Bollingers would now be a corrective signal. Also the RSI was close to crossing back below 70 before today’s gains. A move back below 70 on the daily RSI would now be a corrective signals that a closing level back inside the band would now be a profit taking signal. The hourly chart support around the breakout at $0.7835.
EUR/USD
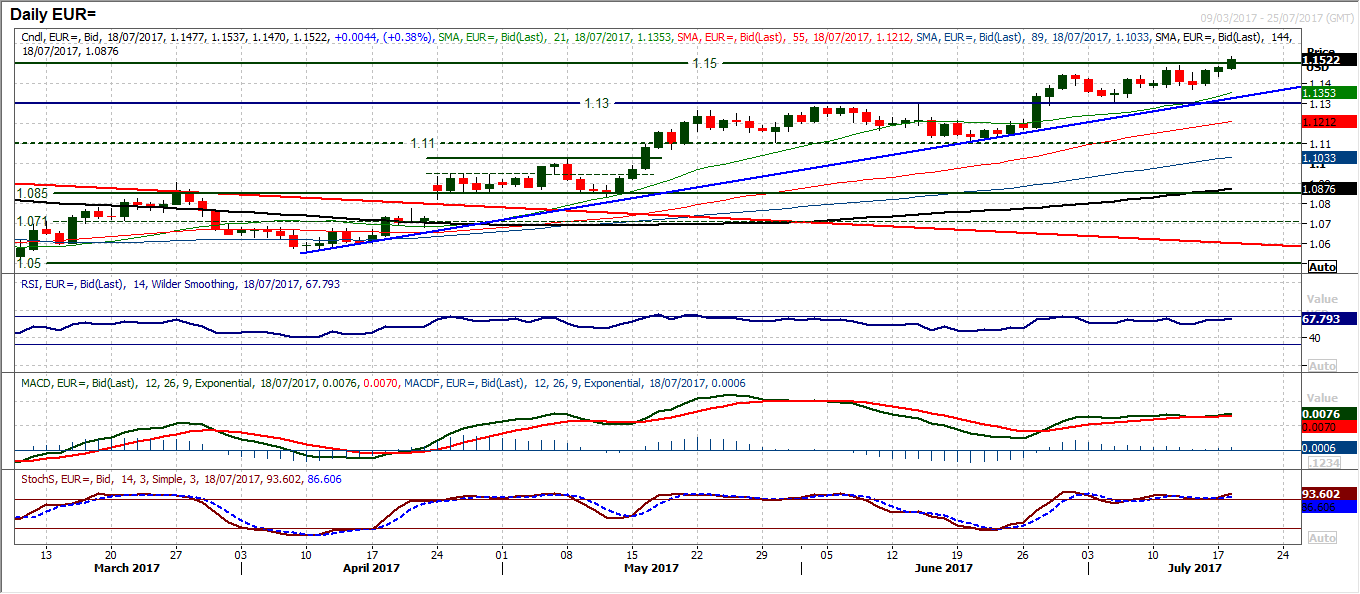
The pair has broken out once more. With such strong momentum that continues to build, it had only seemed like a matter of time, however the renewed weakness of the dollar sine Fridays weak US inflation and retail sales, has helped to drive the break above $1.1500. This had been the broad projection target from the old $1.1100/$1.1300 range breakout, so the target has been achieved. This now means that EUR/USD is trading at its highest since May 2016 when it hit a high of $1.1614, but also on the longer term charts is now testing the top of the two and a half year trading range between $1.0340 and $1.1711. As yet there seem to be little reason not to believe that the euro can continue to push higher, so buying into the intraday dips remains viable. The daily momentum indicators are all strongly configured. The only real caveat on the near term horizon is the ECB on Thursday. $1.1500 is initially supportive, with $1.1490 also breakout resistance. The hourly chart shows support at $1.1433.
GBP/USD
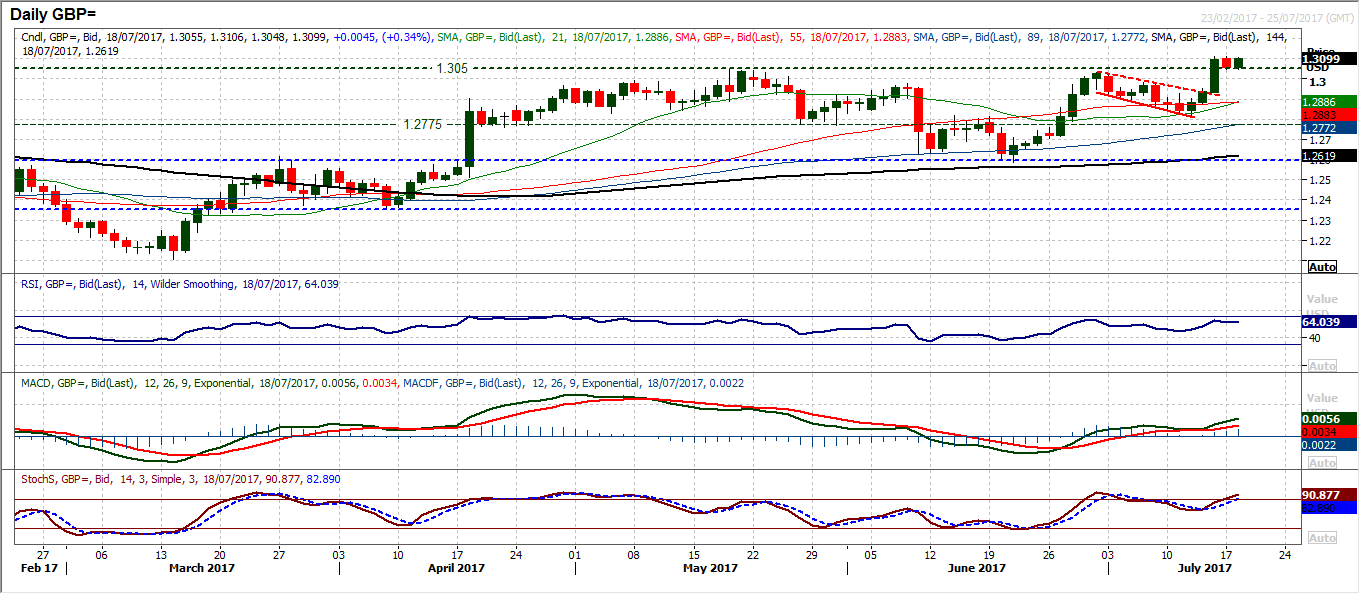
On a strong breakout the market is looking for confirmation that the move will not simply and quickly be retraced. There has been a bit of a wobble on Cable’s breakout but as yet it is holding. Friday’s strong candle breakout was followed by a corrective move which gave back 40 pips yesterday. However the retracement has bounced today from the previous breakout support band $1.3030/$1.3047, having posted a low at $1.3044. The longer the market holds on to this band of old resistance that has turned into new support, the more confident the bulls will be. Momentum is strong still with the RSI above 60 whilst MACD and Stochastics are rising. The next task is for the bulls to breakout above Friday’s high at $1.3113 and to continue the bull run, otherwise there could be a degree of tiredness creeping in. The hourly chart shows an unwinding of near term momentum to levels where the bulls have tended to support. Subsequent upside resistance is $1.3120 before $1.3280. The bulls will remain in control above $1.3000.
USD/JPY
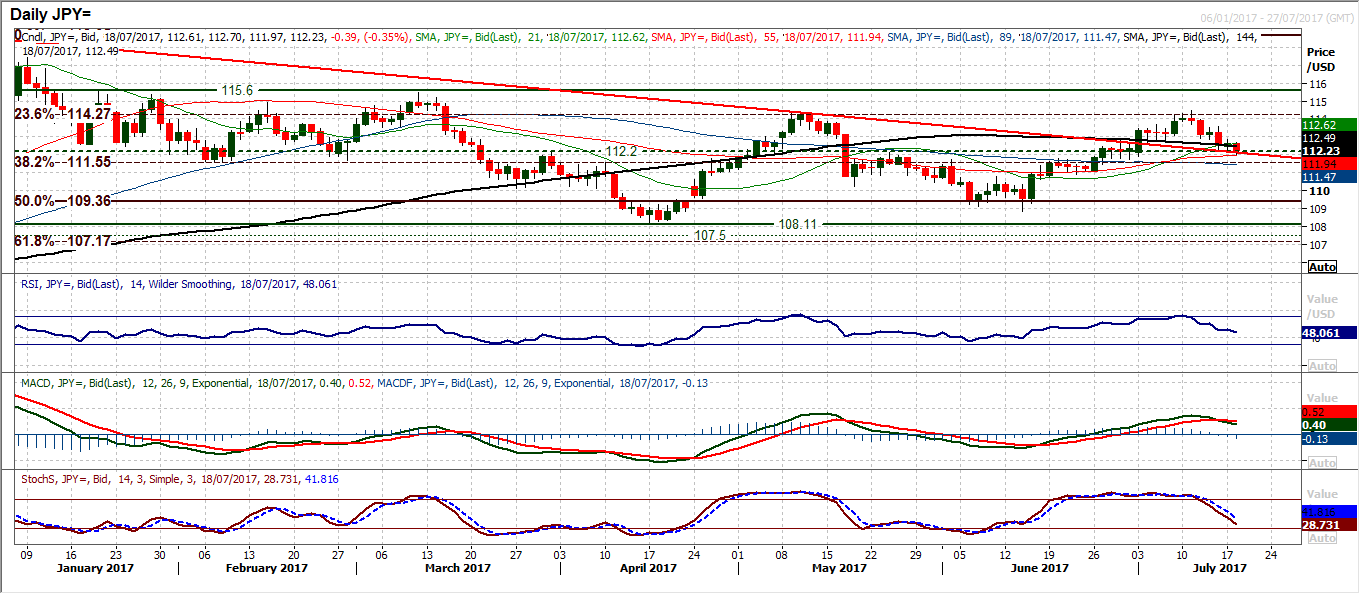
The dollar remains under pressure as the market continues to fall away. The down-days are characterised by strong bear candles, whilst any recovery up-days are beset with struggles to make any headway and turn in effect into consolidation days. Yesterday’s candle was another consolidation day where the bulls failed to make any sustainable impact, before once more resuming the decline overnight. The daily momentum indicators have all now taken on a corrective outlook, with the RSI and Stochastics both falling below 50 and the MACD lines having crossed lower. The pair is now back into the old pivot band 111.55/112.20 so it will be interesting to see the reaction. The likelihood is that the 111.55 support of the 38.2% Fibonacci retracement of 100.07/118.65 which has often been seen as an inflection point will now be tested. The hourly chart shows the resistance at 112.90 is bolstered now as a key level, with 112.25 initially an area of near term overhead supply.
Gold
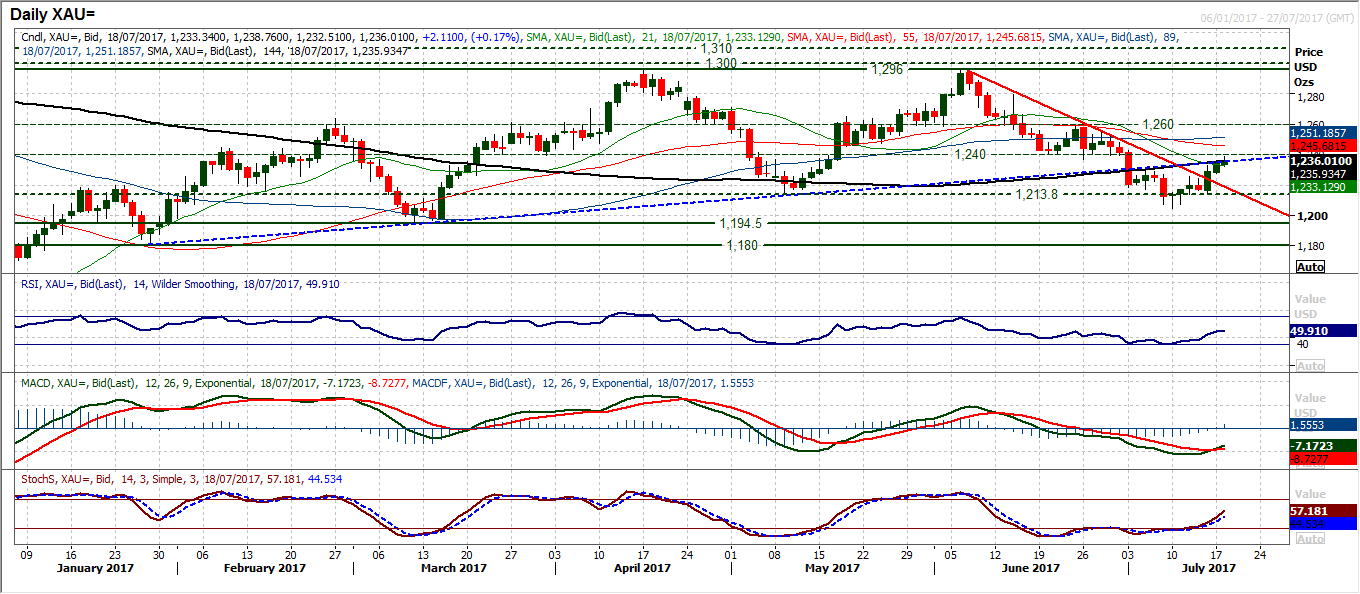
The gold recovery continues to make ground amidst the renewed dollar weakness. The downtrend has been decisively broken and confirmed now, whilst momentum indicators are all now in solid recovery mode. The RSI is rising to 50, the MACD lines have posted a bull cross and the Stochastics are tracking higher. The market has also decisively broken the initial resistance at $1229 which now means that a new trend is in formation. The next test is at $1240. This is the old pivot level in place for much of the year which has seen a series of turning points and numerous consolidations. Furthermore, this is around the underside resistance of the old five month uptrend from the first half of 2017 and the 144 day moving average. It would be a considerable scalp for the bulls to close consistently above $1240, which would subsequently open the next pivot around $1260. The hourly chart shows strong near term momentum, a sequence of higher lows and the old $1229 resistance now becoming supportive.
WTI Oil
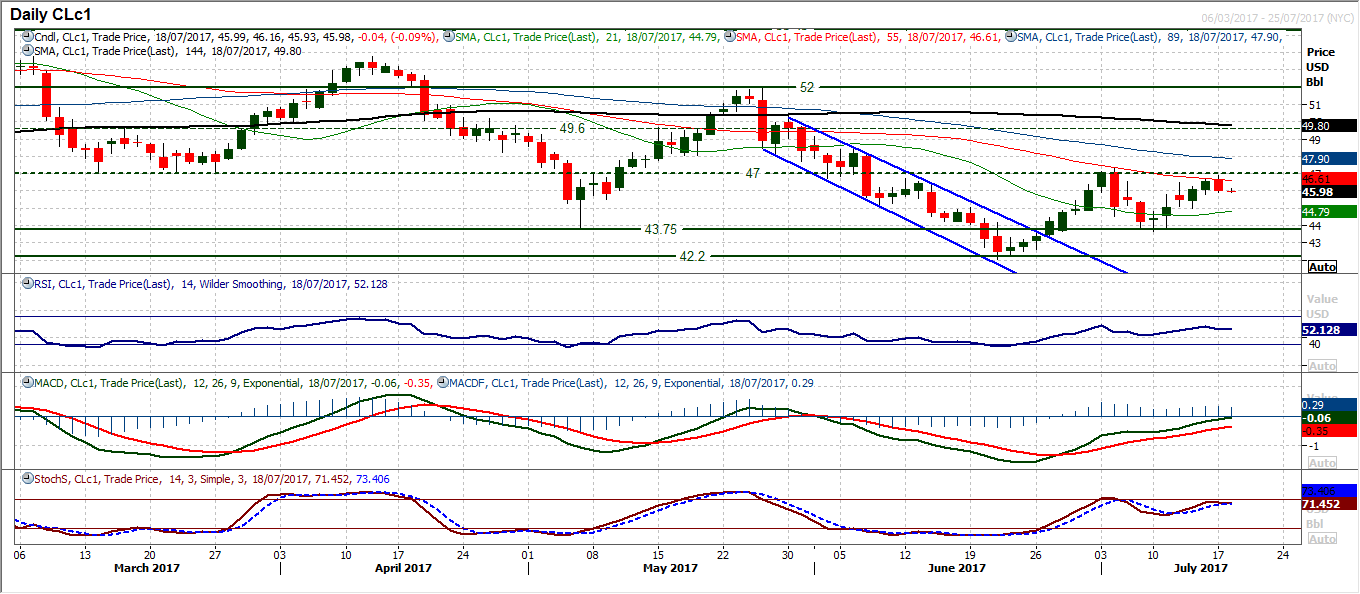
The bulls would regain control on a decisive move back above the pivot band at $47.00, however this is a significant medium term barrier, and one which would complete a five week base pattern. The resistance also coincides with the 50% Fibonacci retracement of $52.00/$42.05 decline and capped the upside (aside from a brief intraday spike to $47.32) at the beginning of July. Yesterday’s candle was disappointing for the bulls with a failure at a high of $46.88 as the momentum indicators (specifically the RSI and Stochastics) also approach key areas where they failed earlier in July. The hourly chart shows a four day uptrend has been broken now with the support of Friday’s low at $45.80 now increasingly key near term. The hourly RSI consistently dropping back below 40 would reflect a less bullish trend, and the hourly MACD line dropping below neutral, but the $45.80 support is key. Below $45.00 support puts $43.75 back in sight.
Dow Jones Industrial Average
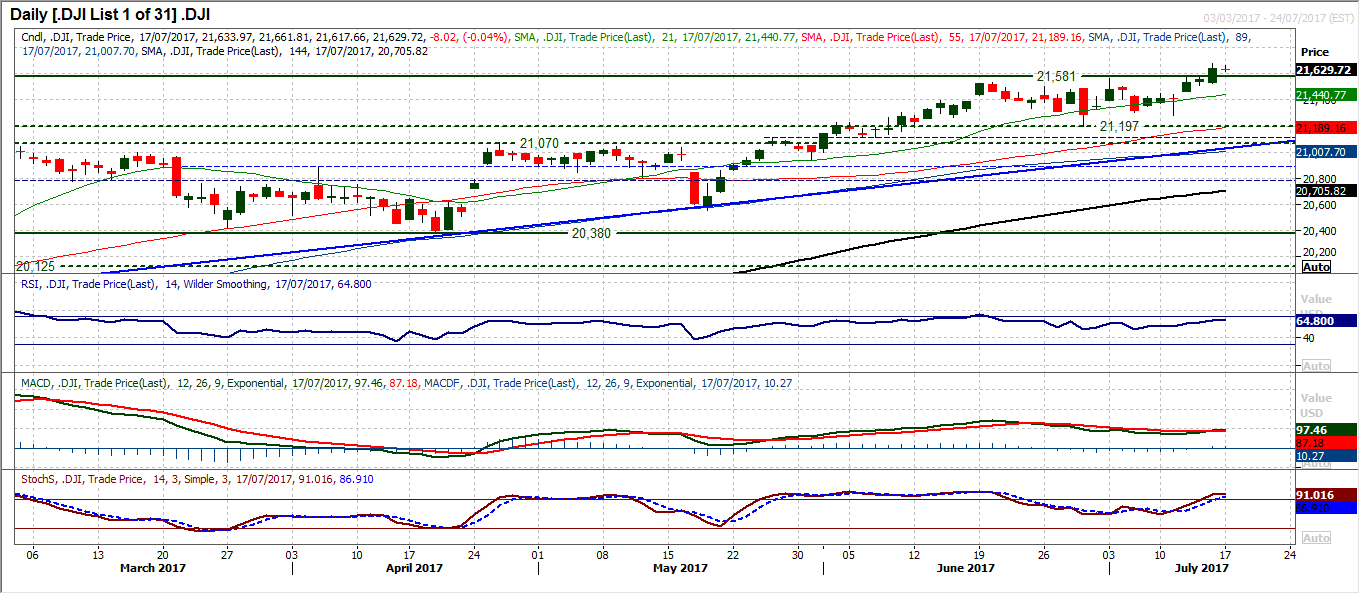
A quiet start to the week with a very tight consolidation candle. A 44 tick candle (when the average true range is currently 142 ticks) on low volume reflects uncertainty now. However, the bulls will point to the consolidation above the previous high at 21,581 which suggests they are confirming the breakout. Momentum on the daily chart remains strong with the MACD lines crossing back higher and the RSI rising in the mid-60s. With the support of Friday’s low at 21,521 there is a 60 tick band of support which the bulls will look to use as a “buy zone” in order to maintain the recent momentum of the breakout. Ultimately though, with strong technical, corrections still remain a chance to buy for further gains. Friday’s all-time high at 21,681 is the resistance now.
Author

Richard Perry
Independent Analyst


