Dollar bulls back in the driving seat

Market Overview
The dollar bulls are back in the driving seat in the wake of Friday’s US labor market data which showed that wage growth was beginning to take hold. The data has helped to drag US Treasury yields sharply higher again. The trade weighted dollar index which had been under pressure during the middle of last week has rebounded over a percent from the low at 101.30, whilst the 10 year yield has also jumped 10 basis points off Friday’s low of 2.33%. Wall Street climbed back to all-time highs but it will be interesting to see if this move can be sustained with the hawkish implications the labor market data has for FOMC monetary policy. Asian markets were mixed overnight but European indices have opened positively again.

In forex markets there is a broadly risk positive outlook with the yen weaker, whilst commodity currencies are stronger. It is also interesting to see the big underperformer being sterling. This comes after big losses on Friday before UK Prime Minister Theresa May’s weekend comments that the UK will not try to keep “bits of EU membership”, see as a nod towards perhaps a harder Brexit. Commodity prices are mixed today with gold and silver around the flat line and oil very mildly higher.
There is little of any significant note on the economic calendar today, however the Eurozone unemployment at 1000GMT could impact the euro, with an expectation of the rate staying stubbornly at 9.8%.
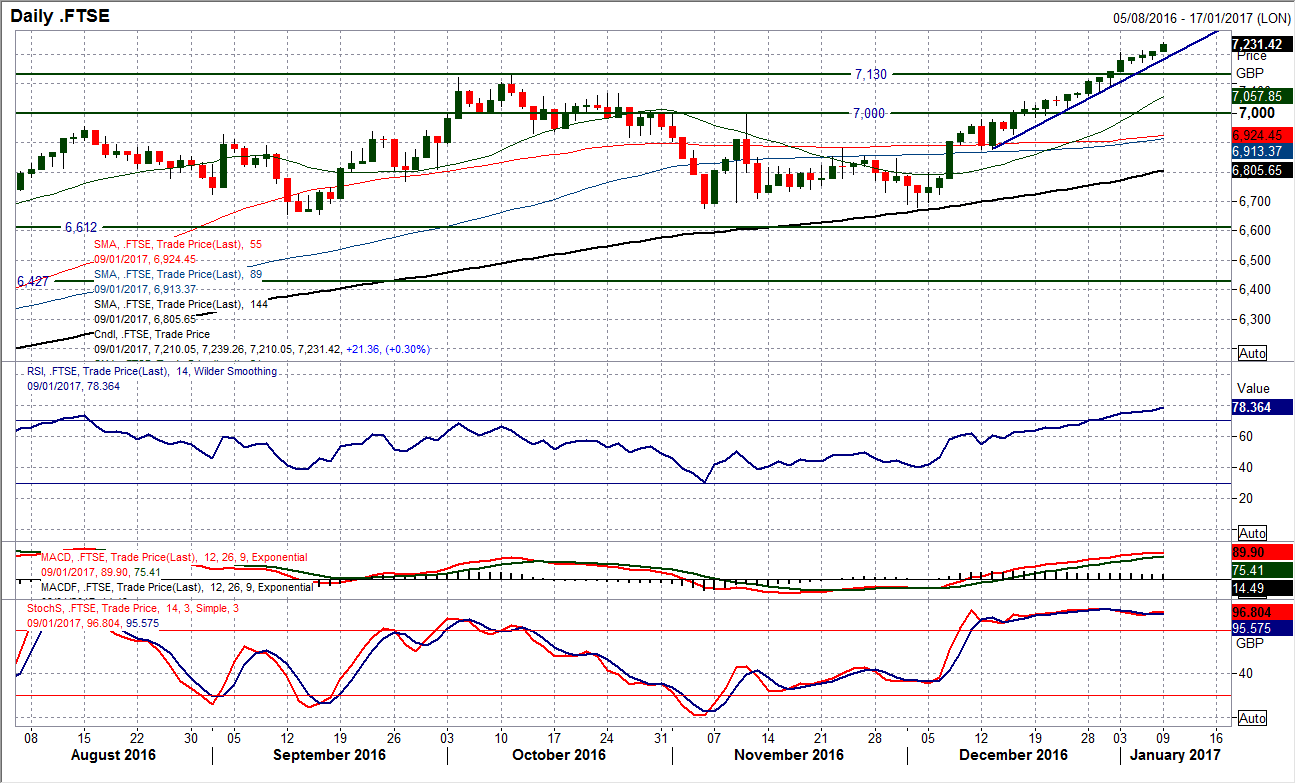
Chart of the Day – FTSE 100
The FTSE 100 has been a mild outperformer of the European markets in recent days, however there is a feeling that this bull run is looking increasingly tired. There have now been 13 positive closes in the past 14 sessions and the RSI is increasingly stretched at over 78. The market looks set up once more for another positive day today which would make it ten consecutive positive closes, something that would be a rare occurrence. However, the daily chart does not show any really concerning technical signals other than the overstretched momentum (which in a bull market can continue for a while), so perhaps we need to be looking for signs of exhaustion, maybe on the hourly chart, which could be beginning to show a few cracks in the bull run. Over the past three weeks the rising 21 hour moving average (currently 7193) has been a good basis of support, and will be watched to see if this starts to be breached. Also the hourly RSI is beginning to post lower highs and if the hourly RSI drops back below 50 this would be a low dating back to mid-December. The price support at 7163 will be watched for a near term breakdown. Although the drift higher continues to post gains, this bull run could be moving into a slowing phase. Are we close to some profit taking? Below 7163 the support is at 7075/7088.
EUR/USD
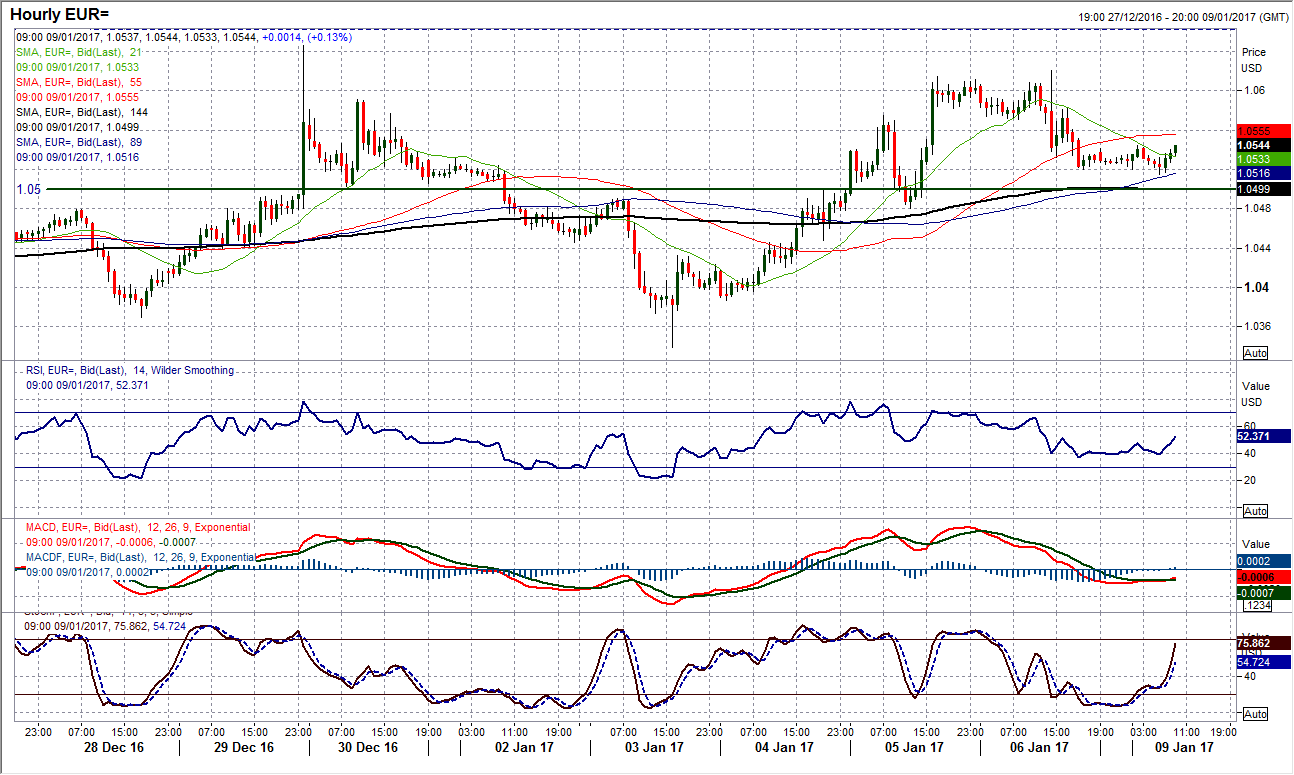
The recovery on EUR/USD looks to be turning lower again as the dollar is beginning to strengthen once more in the wake of the Non-farm Payrolls report. The strong negative candle on Friday is yet to entirely unwind the gains from the middle of last week but the bulls appear to have lost their way in a recovery. I continue to see this rebound as being a bear market rally that is helping to unwind momentum indicators to renew downside potential on a medium to longer term basis. The Stochastics and MACD lines are drifting higher but are close to areas where the rallies from September and December ran out of steam. The hourly chart shows the highs of the last two days around $1.0620 before turning lower. The near term pivot band around $1.0500 will be seen as key today and a breakdown would be confirmed on a move below $1.0480 as the hourly momentum turns more corrective.
GBP/USD
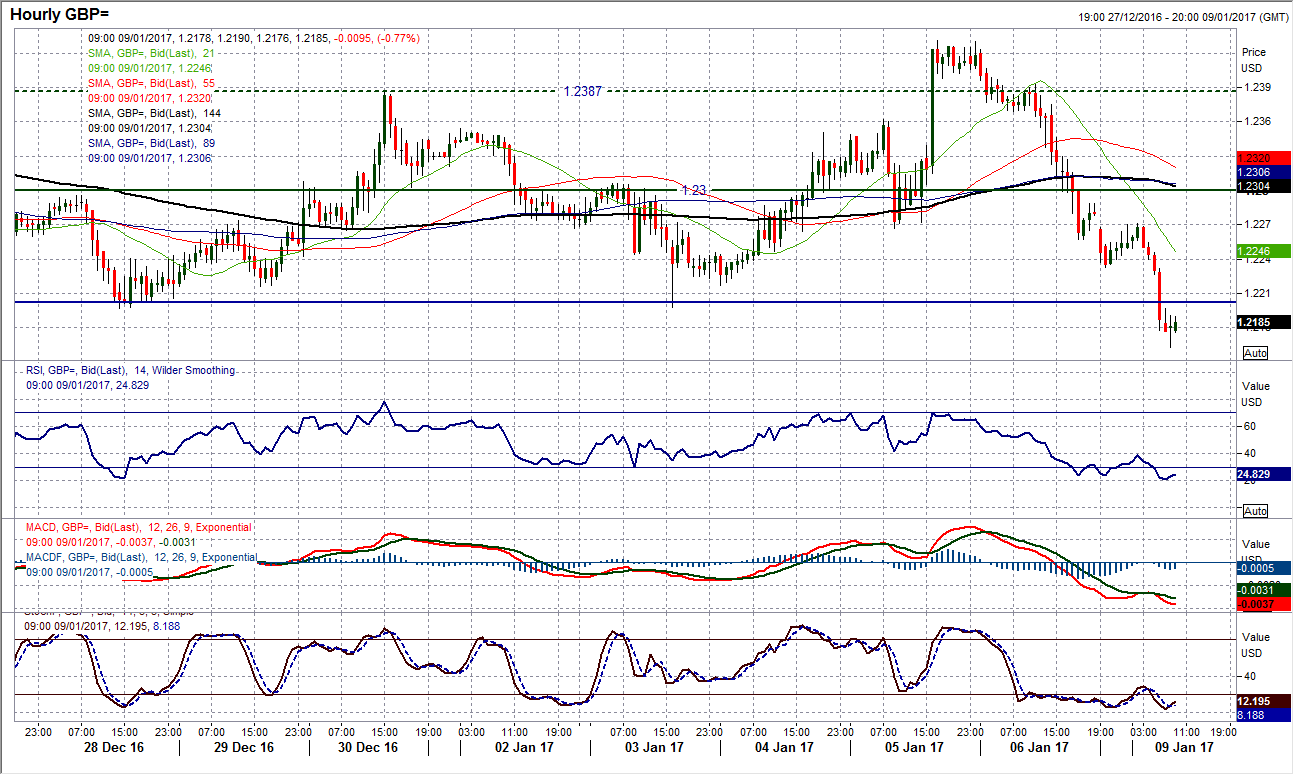
Sterling continues to struggle on a relative basis and when the dollar strength kicks in the bears really tend to come back in force. The recovery during the middle of last week has been blown away by the sharp selling pressure on Friday’s payrolls report and the subsequent downside early today. The support at $1.2197 which had been holding for the past couple of weeks has been broken today and the market is now open for a move back towards $1.2080 which is the key medium term range low. The momentum indicators have turned negative once more with the RSI back under 40 and the Stochastics crossing lower again on the daily chart. The hourly chart shows a minor pivot around $1.2270 with any rallies today seen as a chance to sell. A close below $1.2197 today would be confirmation of the near term bearish break.
USD/JPY
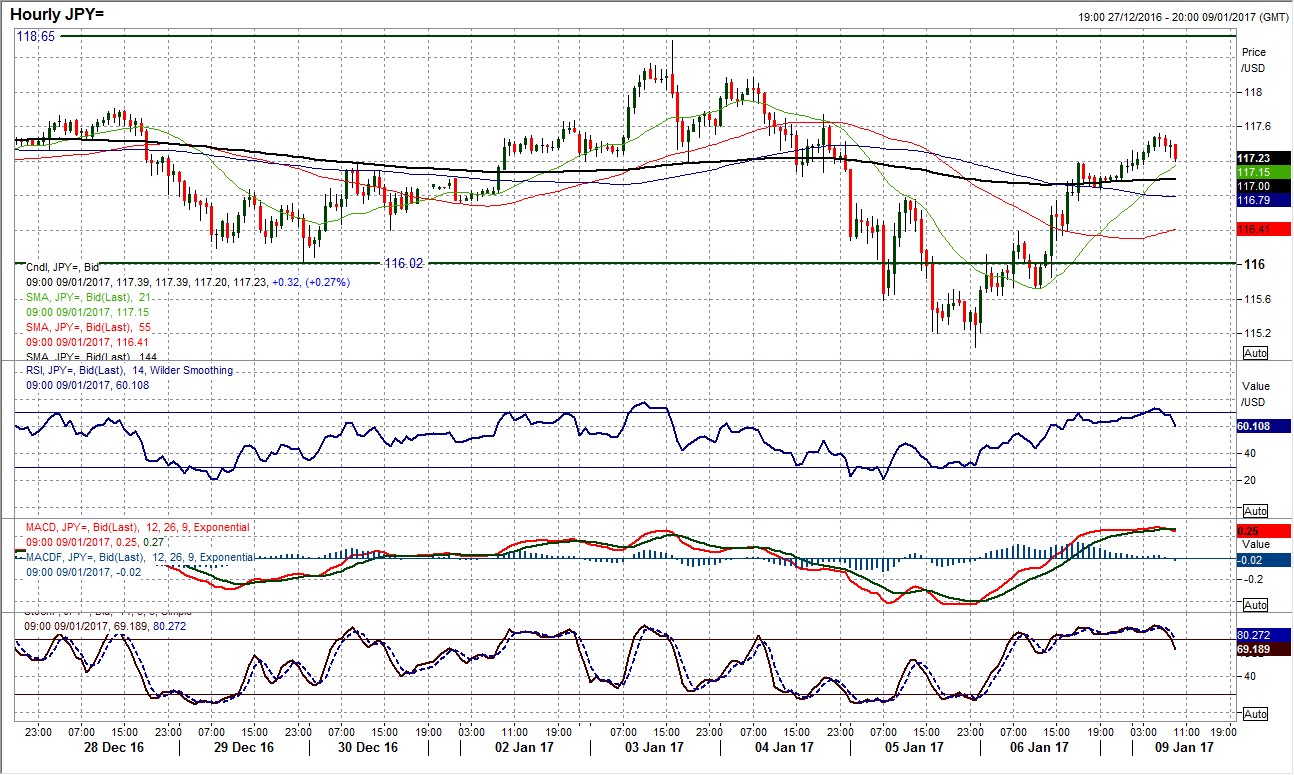
The breakdown during the middle of last week on the move below 116.02 did not last long and the bulls have fought back hard. Leaving a new key low at 115.04 the rebound from Friday’s payrolls closed well back inside the previous range and has once more stamped some bullish authority back on the chart. The response today to the strong bull candle will be seen as key and so far the buyers remain happy to continue to support the move. The momentum indicators look a touch mixed at this time but it is still worth thinking about the strong medium to longer term outlook which is still likely to prevail. The hourly chart shows very little regard being given to resistance as the recovery continues, whilst hourly momentum is strong again and suggests that corrections will be seen as a chance to buy. There is minor support 116.40/116.80 with 116.00 the main area of support once more. The bulls will be eying 117.75, 118.17 and the major resistance at 118.65.
Gold
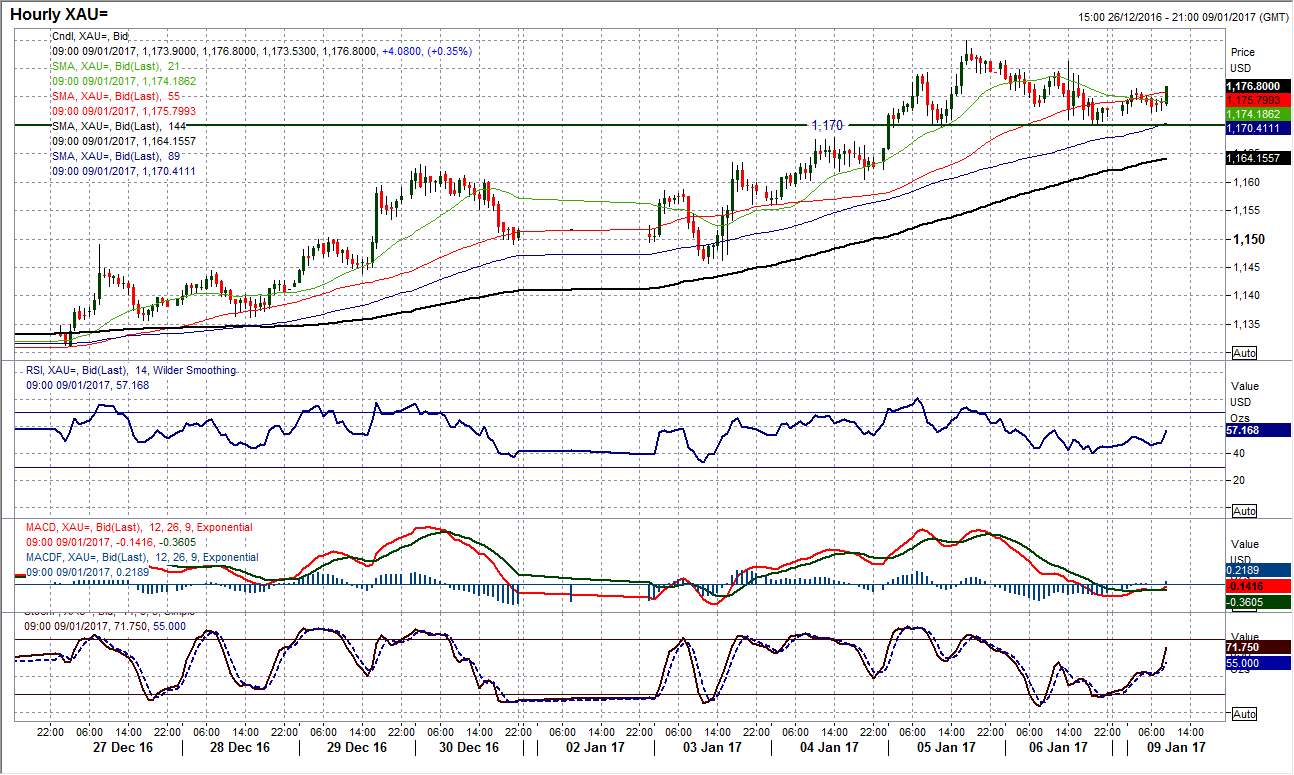
The recovery on the gold price seems to be buffering in the wake of the Non-farm Payrolls report. The resistance in the $1180/$1200 is beginning to take its toll and the market reversed back from $1184.90 to currently trade around the old 61.8% Fibonacci retracement of the $1047/$1375 rally (around $1172). The concern that the bulls will have is the loss of momentum shown in the Stochastics which have crossed lower in a similar fashion to that during early November prior to the big sell-off. The RSI has also turned back from 60, again similar to previous pre-decline signals. The hourly chart shows support at $1170 below which would complete a small top pattern that would imply $15 of immediate downside but also more importantly would be a signal that the bulls had lost control again. The spike high from the initial payrolls volatility is at $1181 with $1185 now key.
WTI Oil
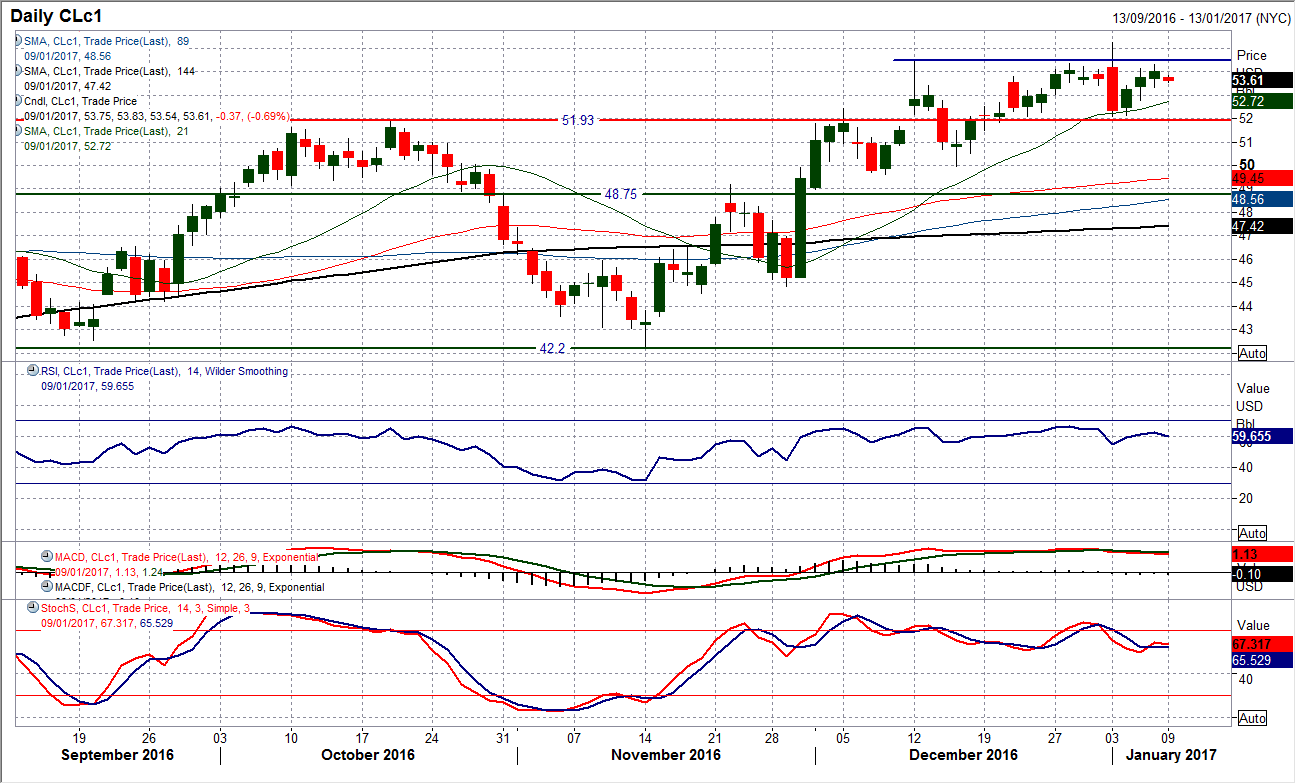
The recovery in oil following the bearish engulfing candle last Tuesday has been heartening for those traders that are long of oil, however more needs to be done to put the bulls back in control. This recent trading phase still has a consolidation look to it as the market remains supported above the key $52.00 breakout, but momentum do not suggest that an upside break will be imminent, because although they are positively configured they lack the impetus for a breakout in recent days. Friday’s rather neutral candle was reflective of this consolidation and it was interesting to see the resistance of the old high at $54.50 still a factor. The hourly chart reflects a mild positive bias on the near term outlook but the shackles seem to be on the bulls for now. A closing breakout above $54.50 would open the upside for at least a retest of $55.25. Support is at $53.30 and $52.80 which adds to support above $52.00.
Author

Richard Perry
Independent Analyst


